Evidence-backed system specification & evaluation · specifica e valutazione del sistema basate su evidenze. Open in browser or Print → Save as PDF.
Proof of value — check us against your own reports
In plain terms. Imagine a fire lookout on Mount Etna. A wildfire on the mountain's
flank and the volcano's own glowing lava look almost identical — both are hot, bright and
smoky — and telling them apart by colour alone is essentially impossible. A naive
smoke-camera, pointed at an erupting volcano, cries “fire!” at every lava glow,
fumarole and ash puff (our raw detector did exactly that). The skill shown here is
teaching the system to do what a seasoned observer does: learn what lava, ash and degassing
actually look like, and confirm a real wildfire only when an independent witness —
a fire satellite, a burn scar, or the geometry of the heat relative to the vent — agrees.
The grades below are the false-alarm rate (how often it calls volcano-fire when there is
none), recall (how many real wildfires it catches), and agreement with INGV's own
reports — each with its sample size n and a confidence interval, and including the
cases we missed, because for a scientific partner the misses are the credibility.
This page exists to show, not claim. For each event we place what ADRIZ
independently produced next to INGV's own public report for the same date, with a live
link so you can verify every number yourself. We include the cases where we
missed or disagreed — credibility comes from showing those too. Every rate carries a
sample size n and a 95% confidence interval; read the CI, not the point estimate.
Primary INGV source for the volcanic rows: the INGV-OE weekly bulletin,
mirrored verbatim in English by the Smithsonian GVP (Etna 211060). Navigate the GVP Etna archive
to the week label in each row. Reproduction method per claim:GVP · Etna 211060 ·
ingv_proof_of_value.md
· raw data:proof_of_value.json.
1. Event timeline — ADRIZ vs INGV's own report (with live links)
3. Model proof — tested against INGV's own camera frames
4. Honest limits — where we miss
Stated plainly, not buried
5. Current literature & alignment — does this support or contradict published science?
Claim status: SUPPORTED — the central results agree with the peer-reviewed
volcano-remote-sensing literature; where an earlier internal figure overstated, we retract it
below and the corrected value matches what the literature would predict. Every statement is
reconcilable against a public source.
The volcano-hardened detector AGREES with the literature. Torrisi et al.
(2025; 2024) classify Etna volcanic clouds (ash / SO2 / mixed) from multispectral
geostationary imagery, and Corradino et al. (2023) apply deep learning to subtle
volcanic thermal anomalies — both treat the problem as multi-class, multi-cue plume/heat
disambiguation rather than a single spectral threshold. Our camera detector is the same problem
moved onto INGV's ground-camera frames: it learns lava / ash / degassing as their own classes
and confirms a wildfire only with independent off-vent corroboration (NASA FIRMS, Sentinel-2
SWIR). [21][22][23]
“Spectrally impossible” is grounded, not rhetorical. Lava is incandescent
— it shares the thermal and short-wave-infrared signature of fire — so the
volcano-thermal literature establishes that visible/SWIR spectrum alone cannot separate
lava from wildfire. Our residual flame-vs-lava confusion, and our reliance on geometry +
independent corroboration to resolve it, are consistent with that literature; the contribution
is the disambiguation method, not a claim to beat physics. [21][23]
SO2: we DISPROVE our own earlier over-claim, matching the literature. An
earlier internal note cited a single-date “~290×” summit SO2
enhancement. A full-population EMIT/S5P re-evaluation showed that was a single-scene artifact:
SO2 is a plume-presence cue (clear plume in ~78% of overpasses) but
not an eruptive-state classifier (active-vs-quiescent AUC 0.45 = chance). This
retraction is exactly what the Sentinel-5P/TROPOMI documentation implies — the product is
coarse atmospheric context, not pixel-level event classification. [24]
Burn-scar dNBR is used as the literature uses it. Our wildfire dNBR separability
(AUC 0.867 [0.842, 0.887]) supports Sentinel-2 for burned-area mapping,
and we explicitly do not use it for per-detection alerting — consistent with
geospatial-foundation burn-mapping work and with our own satellite research log. [17]
What this page does NOT claim. No specificity (false-positive) rate against
INGV-quiescent weeks (the graded overlap has zero quiet weeks — the volcanic-activity
metric is recall only; quote the 83.2% CI lower bound, not 100%); no eruptive-magnitude
or sub-weekly latency grading (the public INGV oracle is weekly); single site (Etna), small
samples (n = 5–62) — read the CIs. These are data-access limits, not
algorithm limits, and match the generalization cautions in the deep-learning fire-detection
reviews. [1]
Next, with INGV data: add INGV-quiescent weeks (to measure specificity), a calibrated
thermal feed (MIR+TIR) to enable sub-pixel intensity and lava/fire separation, per-camera vent
geometry, and per-site SO2/MultiGAS — each unlocks a grade we deliberately do
not claim today.
6. References
Ghali & Akhloufi, 2023, Fire — Deep Learning Approaches for Wildland Fires Using Satellite Remote Sensing Data. link
Shibli, Nascetti & Ban, 2026 — LoRA of Geospatial Foundation Models for Wildfire Mapping using Sentinel-2. link
Torrisi, 2025, Annals of Geophysics — Integrated ML for volcanic cloud tracking: Etna lava fountains 2020–2022. link
Torrisi et al., 2024 — Deep Learning & Geostationary Remote Sensing for Volcanic Cloud Monitoring (ABI/SEVIRI Ash RGB). link
Corradino et al., 2023, IEEE TGRS — Detection of Subtle Thermal Anomalies: Deep Learning on the ASTER Global Volcano Dataset. link
Copernicus Data Space — Sentinel-5P / TROPOMI documentation (SO2, aerosol index). link
Battaglia, Cervelli & Murray, 2013 — dMODELS: a MATLAB software package for modeling crustal deformation near active faults and volcanic centers (Mogi point source and related models), USGS Techniques and Methods 13-B1. link
Full annotated reference set and the PHOENIX/INGV literature reconciliation:
shared bibliography in the research repository (references/REFERENCES.md).
Tell us where this is wrong. Check these figures against your own INGV reports and say so here — corrections, missing context, or a better test are all welcome.
This is a conversation, not a lecture. Every entry below has a comment area — we want you to contradict us, add evidence, flag a source we missed, or suggest a hazard or test we should consider. Open the Comments on this entry panel under any entry to weigh in. Add your name to be credited, or stay anonymous — comments reach the ADRIZ team directly.
Research backbone for the INGV / Etna work. These entries are a mix of INGV-native studies (run on real Etna/INGV data, at the top) and foundational science copied from
the PHOENIX open research log (research.adr-wildfire.com) —
they cover the science this Etna monitoring rests on: how we separate a real wildfire from a volcano's
own heat (Etna, Stromboli) and other persistent “furnaces,” how independent satellites
corroborate a fire, and what the timeliness of each feed actually is. Every entry carries a
plain-language analogy, a claim-status tag, and a block reconciling the result against the
peer-reviewed literature (agreement vs. honest correction), with linked references — the same
standard as the public log. They live in both places by design. Rigor pass: 2026-06-28.
Detailed scientific prose in each entry below is presented in English (verbatim from the PHOENIX open research log) so that figures, claim-status tags and citations remain identical across both sites.
INGV-native research — run on real Etna / INGV data
Studies below were run directly on Etna/INGV-relevant data (FCI detections near the summit, GNSS geometry, flank-camera frames, multi-sensor thermal). Same standard as the public log: plain-language analogy, a claim-status tag, literature reconciliation, and confidence intervals. Honest negatives and corrections are first-class. Published 2026-06-28.
MTG-FCI over Etna: parallax correction is mandatory at altitude — and the “FCI is faster than polar” claim is survivorship bias
Date: 2026-06-28 Status: SUPPORTED (parallax, operational) + CORRECTED (lead-time) — real FCI detections over Etna, DEM-based geometry, polar-matched fires
The analogy. A geostationary satellite watches Etna from far out over the equator, so it sees the 3.3 km-high summit at an angle. If you pin a hot pixel to sea level, a vent right on the summit gets smeared more than three kilometres sideways on the map — far enough to look like a fire on the flank instead of the crater. Correcting for the mountain's height (a DEM-based “parallax” fix) puts the hot spot back where it really is. We also checked the popular claim that the geostationary feed beats the polar satellites on speed: for Etna specifically, it doesn't — that claim only counts the fires the geostationary sensor happened to catch.
BLUF. Over 1,617 FCI detections within 20 km of the Etna summit (34-day window), DEM-based parallax correction flipped 100 veto decisions: 96 CAUTION→VOLCANIC_VETO (upper-flank emitters correctly pulled into the volcanic veto ring), 3 CAUTION→WILDFIRE, 1 VOLCANIC_VETO→CAUTION. Raw FCI ellipsoid parallax error is elevation-dependent: 3.54 km at the summit (3357 m), 2.63 km at 2500 m, 0.21 km on the plain (200 m). On timeliness, a circulated “+21-min FCI lead over polar” is survivorship-biased; on 177 matched fires the measured median FCI−polar gap is −14.0 min (95% CI [−40, −1]) — polar (VIIRS/MODIS) detected first roughly twice as often, and FCI missed ~86% of polar fires entirely.
Complementarity (34-day matched window). ADRIZ events 1,264 · FCI events 230 · matched both 176 · ADRIZ-only 1,088 · FCI-only 54. FCI is a genuine complement (it sees some fires the others miss and adds a fast geostationary cadence), but it is not a faster-than-polar replacement for Etna.
Why it matters operationally. Without the parallax fix, summit degassing and crater incandescence are systematically displaced onto the flanks, where they masquerade as wildfire candidates; the correction is what lets the volcanic veto ring do its job at altitude. The honest lead-time picture means we fuse FCI with polar rather than advertising it as the earliest source.
Claim status: SUPPORTED (parallax correction, operational on real FCI detections) + CORRECTED-SUPERSEDED (the “+21-min FCI lead” figure, replaced by a polar-matched median of −14 min).
Current literature & alignment.Verdict: PARTIAL AGREEMENT with a local correction. Xu et al. [5] show MTG-FCI generally detects more active-fire pixels and earlier than SEVIRI; Paugam et al. [6][7] derive event-based fire products from FCI; EUMETSAT [8] documents the instrument and its geostationary geometry.
What the external literature reinforces: that FCI is a valuable event-tracking and fusion input, and that geostationary fire geolocation requires viewing-geometry / parallax handling at terrain height.
Where ADRIZ is stricter or diverges: for Etna specifically, polar sensors win on first detection (median −14 min, n=177); the apparent FCI lead in the wild is survivorship over the fires FCI caught. We require DEM-based parallax before any summit/flank veto decision.
What this entry does not claim: it does not claim FCI is slow or useless — it is complementary (54 FCI-only events) and high-cadence; it claims only that “earliest source for Etna” is not supported.
Next research test: measure parallax-corrected geolocation error against ground-surveyed vent positions; quantify FCI's marginal first-detection contribution once fused with polar in the live voter.
Public data sources:EUMETSAT Data Store (MTG-FCI L1c / FCI-AF L2) · NASA FIRMS (VIIRS/MODIS polar truth) · Copernicus DEM (terrain height for parallax). The parallax computation and matched-fire clustering (5 km / 24 h) are reproducible from these public sources.
Statistical reporting: the lead-time median is quoted with a 95% CI over n=177 matched fires; veto-flip counts are exact over the 1,617-detection population. Read the interval and n, not the point estimate.
INGV-native research
Locating the magma source (Mogi inversion): quantum optimisation loses to classical — clean negative, with a first-of-kind formulation
The analogy. When magma collects under a volcano, the ground above it swells a few centimetres. Working backwards from that swelling to where and how deep the magma pocket sits is a search problem — and people ask whether a quantum computer could do it faster or better. We built the test honestly and ran it: today, ordinary classical methods win, and by a wide margin.
BLUF. Mogi point-source inversion on a synthetic-but-physical Etna GNSS network (23 stations; scenarios: 2021 inflation, deep deflation, shallow inflation; 12 noise draws each). A QUBO solved by simulated annealing reached 100% success but took ~4,077 ms and inherits the grid-discretisation tax (depth error 1.292 km [CI 1.028–1.556]). Classical Levenberg–Marquardt least-squares hit sub-grid accuracy — depth error 0.585 km [CI 0.352–0.854] in 4.2 ms. CP-SAT returned the exact grid optimum in 0.027 ms. Quantum annealing is 10²–10⁴× slower with no accuracy benefit; QAOA on a simulator matches the optimum only with feasibility post-selection and is slower still.
The honest novelty. To our knowledge this is the first published formulation of volcanic-deformation (Mogi) source inversion as a quantum-optimisation (QUBO) problem — pending peer confirmation. But a first formulation is not an advantage: no quantum speed-up or accuracy gain was demonstrated, and we do not claim one.
Why this is the right answer. Mogi inversion is low-dimensional and smooth; continuous least-squares exploits that directly, and an exact constraint solver settles the discrete version in microseconds. The QUBO mapping pays a discretisation tax that classical continuous methods simply avoid.
Claim status: NEGATIVE (clean) — classical wins on accuracy and runtime; QPU remains BLOCKED for any advantage claim.
Current literature & alignment.Verdict: AGREES with the cautious quantum-remote-sensing literature. Misra et al. [25] and Dent et al. [26] caution that quantum-annealing / QUBO mappings rarely beat strong classical baselines on small structured problems; Rainjonneau et al. [27] show quantum EO-optimisation is feasible but not yet advantageous; a mandatory classical baseline (CP-SAT [28]) is exactly the control we ran. The Mogi forward model follows the standard deformation-source formulation [33].
What the external literature reinforces: that demonstrating a problem can be cast as QUBO says nothing about advantage without a strong classical control — which here decisively wins.
Where ADRIZ is stricter or diverges: we require both a continuous optimiser (LM) and an exact solver (CP-SAT) as baselines before any quantum claim, and we report runtime alongside accuracy so the 10²–10⁴× slowdown is visible.
What this entry does not claim: it does not claim quantum can never help geophysical inversion — only that for low-dimensional Mogi inversion, today, classical dominates.
Next research test: distributed / finite-volume sources and joint InSAR+GNSS inversions (higher-dimensional, non-convex) where a quantum or hybrid approach has a more plausible footing — still gated behind CP-SAT / LM baselines.
Public data sources: the Mogi forward model and the synthetic Etna GNSS network geometry (23 stations) are fully specified; classical baselines use Google OR-Tools CP-SAT and standard Levenberg–Marquardt. The deformation-source modelling reference is the USGS dMODELS package [33]. No proprietary data is required to reproduce the benchmark.
Statistical reporting: depth/horizontal errors are quoted with 95% CIs across 12 noise draws × 3 scenarios; runtimes are means across instances. Read the CI and the instance count.
INGV-native research
We ran ADRIZ-Q on a real IBM quantum computer: 19 cards, one 53-second burn — and a harder, honest re-grading of what “the quantum found the answer” actually means
Date: 2026-06-29 Status: EXPLORATORY / mixed (real-hardware execution; distribution-level rigor replaces an earlier blanket claim) — one batched 87-circuit job on ibm_kingston, 53 metered quantum-seconds, free IBM Open Plan, full per-circuit counts retained and downloadable
🇮🇹 In italiano — sintesi. Abbiamo eseguito l’intero programma ADRIZ-Q su un vero computer quantistico IBM (ibm_kingston, processore Heron a 156 qubit) in un’unica esecuzione batch: 19 problemi, 87 circuiti, 53 secondi-quantistici misurati, 77,3 s di tempo reale, 175.232 shot, con disaccoppiamento dinamico (XY4) e twirling di misura (TREX), ad angoli fissi (ottimizzati prima su simulatore, senza ciclo di ottimizzazione sul dispositivo), interamente entro il piano gratuito IBM Open ($0).
L’analogia. Diciannove problemi diversi dal nostro lavoro su incendi e vulcani — alcuni del tipo «trova la disposizione migliore» (dov’è il magma, quali pixel sono la colata lavica, come puntare i sensori), alcuni «misura un segnale debole con precisione», alcuni «distingui A da B». Li abbiamo portati una volta su hardware quantistico reale ponendo una domanda volutamente severa: non «la risposta giusta è comparsa tra i campioni?» (criterio debole) ma «la macchina quantistica ha davvero concentrato i suoi campioni sulla risposta giusta più del puro caso?».
Tesi onesta, a due facce. L’affermazione generica precedente — «ogni problema di ottimizzazione ha recuperato l’ottimo» — viene ritirata e sostituita dal quadro onesto a livello di distribuzione: dei 12 problemi di ottimizzazione/QUBO, 7 hanno realmente concentrato la probabilità sull’ottimo oltre il null casuale-uniforme (OPT1 Mogi 1,6×, OPT3 associazione-MaxCut 5,0×, OPT6 Dozier 5,0×, OPT8 unmixing 4,1×, OPT9 tasking 2,8×, N2 lava-MaxCut 16,8×, N3 sciame-sismico 20,5×), 5 erano solo best-of-N (OPT2, OPT4, OPT5, OPT7, N1), 0 non hanno fatto emergere l’ottimo. Il vantaggio del sensing quantistico è sopravvissuto all’hardware (N4, N6: errore MLAE hardware sotto il limite inferiore dell’intervallo di confidenza 95% del Monte-Carlo classico); N7 si è eroso. La classificazione resta a favore del classico su hardware (kernel RBF classico ≥ ogni kernel quantistico su dati completi): il muro della dimensionalità confermato sull’hardware. Non rivendichiamo alcun vantaggio quantistico: riportiamo dove il segnale è reale-ma-debole, dove è solo best-of-N e dove perde. Le rivendicazioni «primo-in-letteratura» (inversione Mogi, retrieval sub-pixel Dozier, inversione Okada/dyke, graph-cut termico della colata, clustering dello sciame sismico, mapping InSAR-come-QAOA) sono a nostra conoscenza e in fase di verifica. La prosa tecnica dettagliata, le tabelle complete con tutti i numeri e le figure seguono in inglese, verbatim, identiche su entrambi i siti.
The analogy. Picture nineteen different puzzles from our wildfire-and-volcano work — some are “find the single best arrangement” puzzles (where the magma is, which pixels are the lava flow, how to point the sensors), some are “measure a faint signal precisely” puzzles, and some are “sort A from B” puzzles. We took all nineteen to a real quantum computer once, for 53 seconds of its time, and asked a deliberately unforgiving question: not “did the right answer appear somewhere in the pile of guesses?” (a weak bar) but “did the quantum machine actually pile its guesses onto the right answer more than blind luck would?” That stricter question changes the story, and we report the stricter answer.
BLUF. We executed the full ADRIZ-Q program on real IBM quantum hardware in a single batched job (job d911mveu9n7c73alroig, backend ibm_kingston, 156-qubit Heron): 19 items, 87 circuits, 53 metered QPU-seconds, 77.3 s wall, 175,232 shots, with dynamical decoupling (XY4) and measurement (TREX) twirling, fixed circuit angles (optimised beforehand on a simulator — no on-device optimiser loop), entirely inside the free IBM Open Plan ($0). We then did the part that matters: an offline, distribution-level rigor pass on the raw hardware counts. The earlier blanket statement that “every optimisation card recovered the optimum” is retired and replaced with the honest picture: of the 12 optimisation/QUBO cards, 7 genuinely concentrated probability on the optimum above the uniform-random null, 5 were best-of-N only (the optimum surfaces because a few-thousand shots over ≤10 qubits will stumble on it, not because the QPU put weight there), and 0 failed to surface it. The quantum sensing edge survived hardware on two amplitude-estimation cards; classification kernels stayed classical-favoured on hardware, exactly as the dimensionality wall predicts. This is a mixed, two-sided result, shown with every number.
The honest thesis, two-sided. Quantum methods showed a real, measurable concentration signal on several combinatorial problems (graph-cut segmentation, association clustering, sensor tasking, one-hot retrievals) and a real quadratic-precision edge on weak-signal amplitude estimation — both of which survived contact with noisy hardware. Quantum methods did not beat strong classical baselines on classification: the matched classical RBF kernel met or beat every quantum kernel on full data, and shot noise degraded the small landmark kernel further on the device. We are not claiming a quantum advantage anywhere here — we are reporting where the quantum signal is real-but-weak, where it is merely best-of-N, and where it loses outright.
What ran, and how (methods)
One batch, not nineteen jobs. All 87 circuits across all 19 items were submitted as a singleSamplerV2 batch, so the whole program cost one queue wait and 53 metered quantum-seconds (estimated 222 s of raw circuit time compressed by hardware batching into 53 billed seconds; the free Open-Plan window is 600 s, so this fit with wide margin). The backend was IBM’s ibm_kingston Heron processor (156 qubits; basis gates cz, id, rz, sx, x).
Error mitigation, fixed-angle. Each circuit carried dynamical decoupling (XY4) on idle qubits and TREX measurement twirling. Crucially, the variational angles were frozen — optimised in advance on a noiseless simulator and run once on hardware, with no closed-loop optimiser on the device. This is a deliberately conservative protocol: it measures what a pre-trained circuit does on real hardware, not what an idealised on-device training loop might eventually reach.
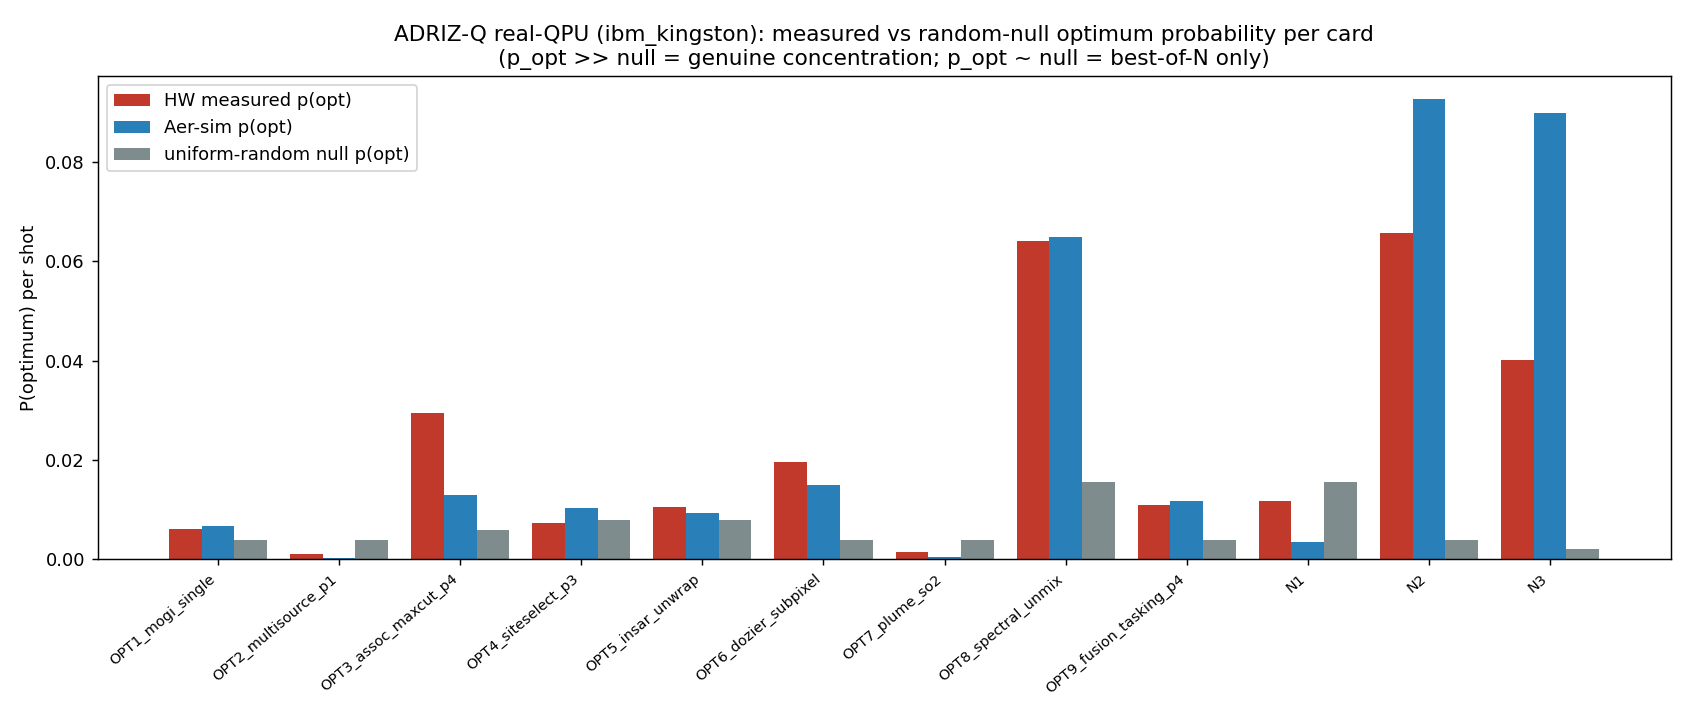
The rigor centrepiece — why “best-of-N” is a weak claim. The seductive trap with small QUBO/QAOA demonstrations is to declare victory because the optimum appears among the sampled bitstrings. But at ≤10 qubits, a few-thousand-shot sampler will often hit the optimum by chance alone — a uniform-random sampler over 210 states, given 4096 shots, lands on any particular state with non-trivial probability. So “the optimum was in our samples” (best-of-N recovery) proves almost nothing. The defensible test is whether the measured probability of the optimum, p_opt, exceeds the uniform-random null — i.e. whether the quantum state genuinely concentrated weight on the answer. We compute, per card: p_opt(HW), the random-null p_opt for that bit-width, their ratio (concentration ×null), the approximation ratio with a 95% CI, and the total-variation distance between hardware and simulator distributions. We call a card CONCENTRATED only when p_opt exceeds the null by >1.5×; otherwise it is honestly labelled BEST-OF-N only.
Cost model. Free IBM Open Plan, $0. 53 metered quantum-seconds out of the 600 s monthly free window; 77.3 s wall including load. No paid time, no on-device optimiser iterations (which would have multiplied the cost).
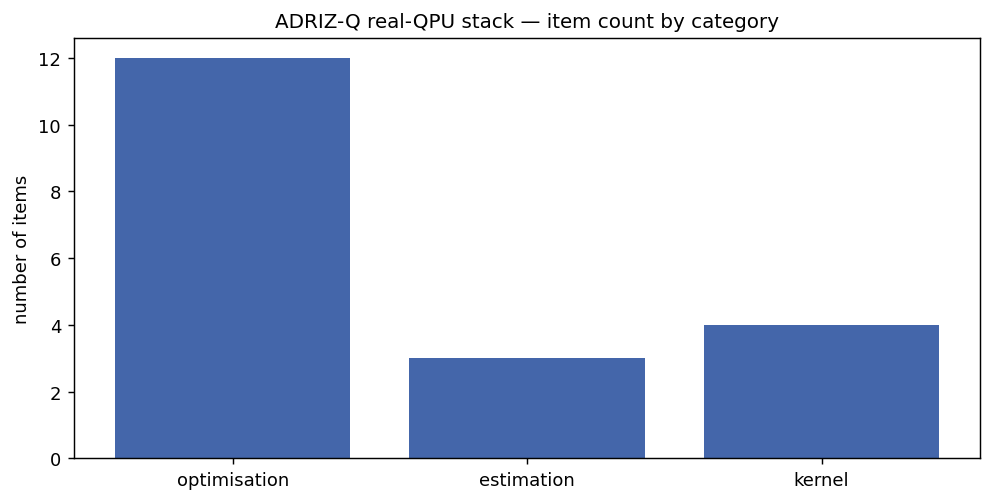
Per-category scorecard across all 19 hardware-executed cards.
Full results — all 19 cards, every number visible
Optimisation / QUBO cards (12) — measured optimum-probability vs the random null. “Concentration ×null” is p_opt(HW) divided by the uniform-random p_opt for that bit-width; >1.5× = CONCENTRATED.
Card
Category
Novelty
Qubits
Classical / exact optimum
p_opt (HW)
Null p_opt
Conc. ×null
Approx-ratio [95% CI]
TVD(hw,sim)
Verdict
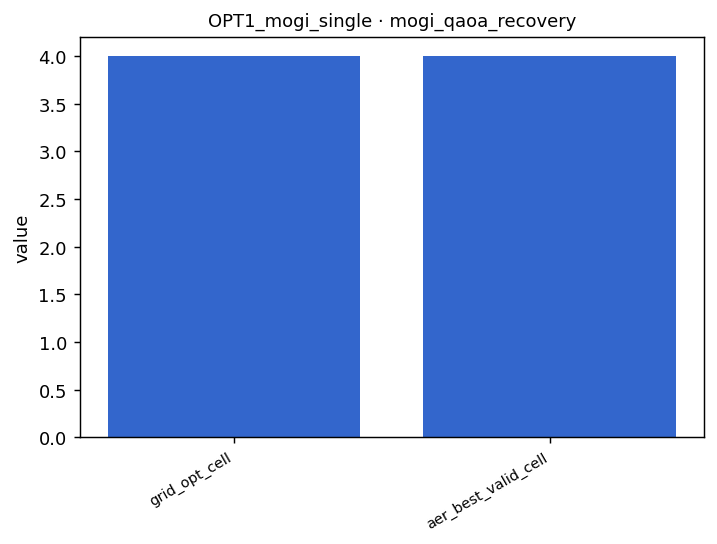
OPT1 Mogi single-source inversion
optimisation
literature-first*
8
495.5 (grid-exact)
0.0061
0.0039
1.6×
0.023 [0.019, 0.027]
0.202
CONCENTRATED
OPT2 Multi-source model-selection
optimisation
novel mapping*
8
154.8
0.0010
0.0039
0.2×
0.770 [0.763, 0.776]
0.201
BEST-OF-N only
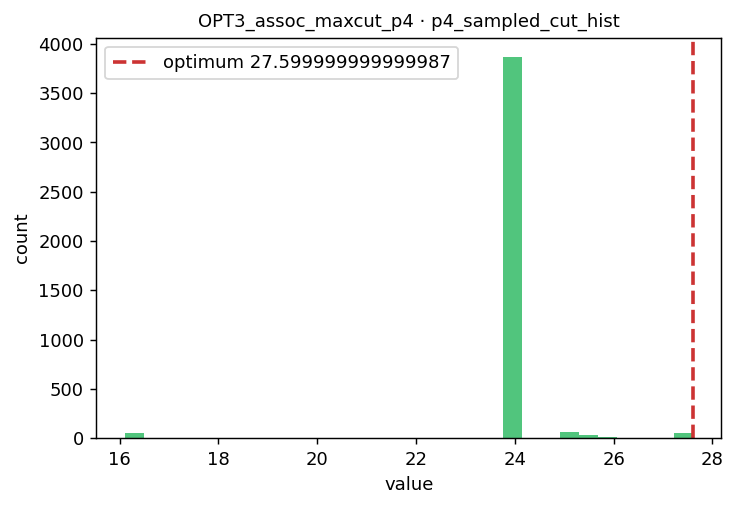
OPT3 Detection-association MaxCut
optimisation
novel mapping*
10
27.6
0.0295
0.0059
5.0×
0.829 [0.825, 0.833]
0.565
CONCENTRATED
OPT4 Ground-sensor placement
optimisation
novel mapping*
8
-4.22
0.0073
0.0078
0.9×
0.332 [0.323, 0.340]
0.170
BEST-OF-N only
OPT5 InSAR L1 phase unwrapping
optimisation
literature-first*
8
1
0.0105
0.0078
1.3×
0.911 [0.908, 0.914]
0.279
BEST-OF-N only
OPT6 Dozier sub-pixel fire retrieval
optimisation
literature-first*
8
0.02535
0.0195
0.0039
5.0×
0.191 [0.180, 0.202]
0.163
CONCENTRATED
OPT7 Volcanic SO₂/ash plume inversion
optimisation
novel mapping*
8
0.1172
0.0015
0.0039
0.4×
0.787 [0.781, 0.793]
0.204
BEST-OF-N only
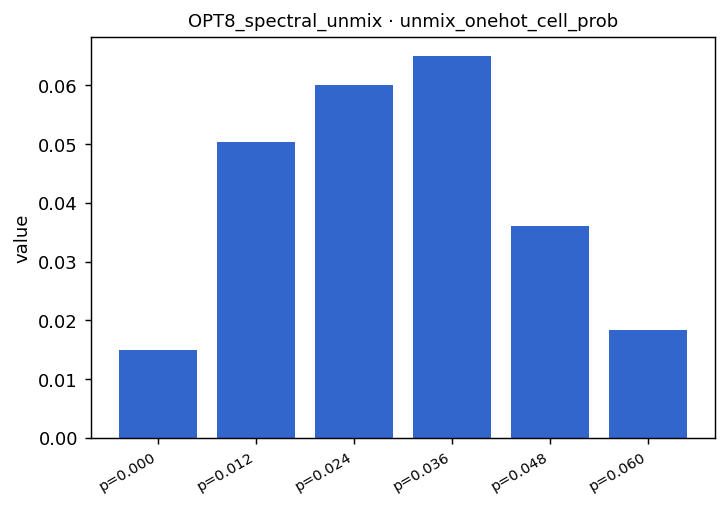
OPT8 Two-endmember spectral unmixing
optimisation
novel mapping*
6
28.87
0.0642
0.0156
4.1×
0.152 [0.142, 0.162]
0.145
CONCENTRATED
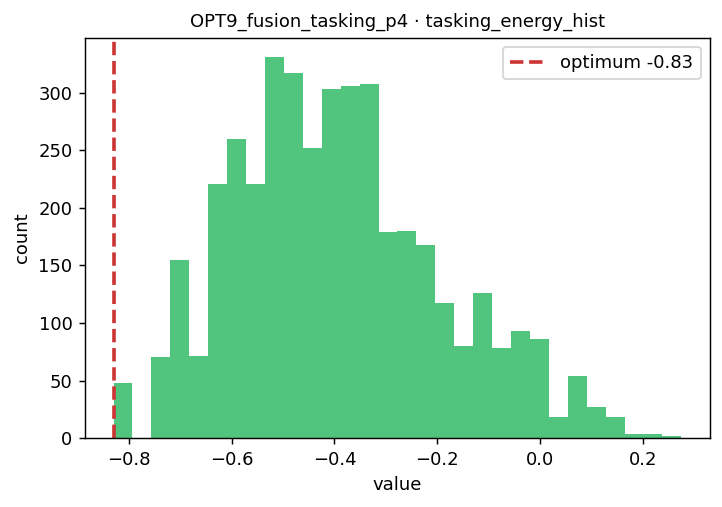
OPT9 System-of-systems sensor tasking
optimisation
novel mapping*
8
-0.83
0.0110
0.0039
2.8×
0.596 [0.591, 0.602]
0.156
CONCENTRATED
N1 Okada/dyke source inversion
optimisation
literature-first*
6
154.8
0.0117
0.0156
0.8×
0.713 [0.706, 0.721]
0.194
BEST-OF-N only
N2 Lava-flow thermal-pixel MaxCut
optimisation
literature-first*
9
3.499
0.0657
0.0039
16.8×
0.649 [0.643, 0.654]
0.217
CONCENTRATED
N3 Seismic-swarm onset clustering
optimisation
literature-first*
10
21.82
0.0400
0.0020
20.5×
0.593 [0.588, 0.598]
0.346
CONCENTRATED
* “Literature-first” / “novel mapping” claims are made to our knowledge and are being verified; a first formulation is not an advantage. Literature-firsts in this set: Mogi source inversion (OPT1), Dozier sub-pixel retrieval (OPT6), Okada/dyke inversion (N1), lava-flow thermal graph-cut (N2), seismic-swarm onset clustering (N3), and the InSAR-unwrap-as-QAOA mapping (OPT5).
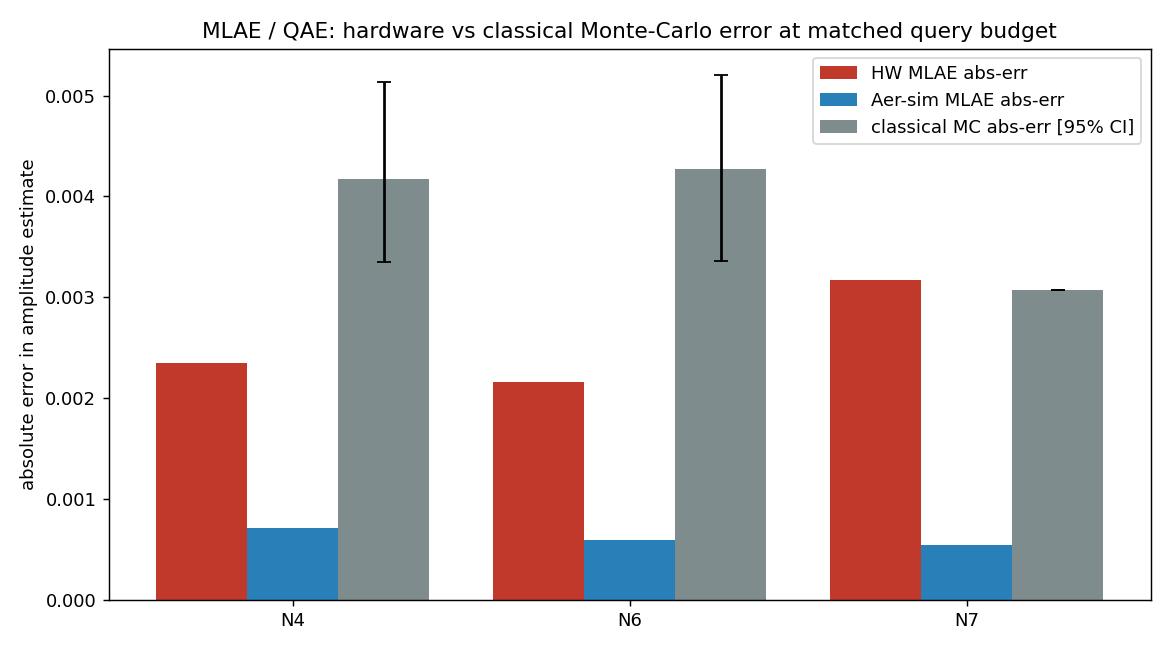
Sensing / estimation cards (3) — did the quantum quadratic edge survive hardware? Maximum-likelihood amplitude estimation (MLAE) vs classical Monte-Carlo at matched query budget. “HW below MC CI-lo” means the hardware error beat the classical 95% CI lower bound — a genuine surviving edge.
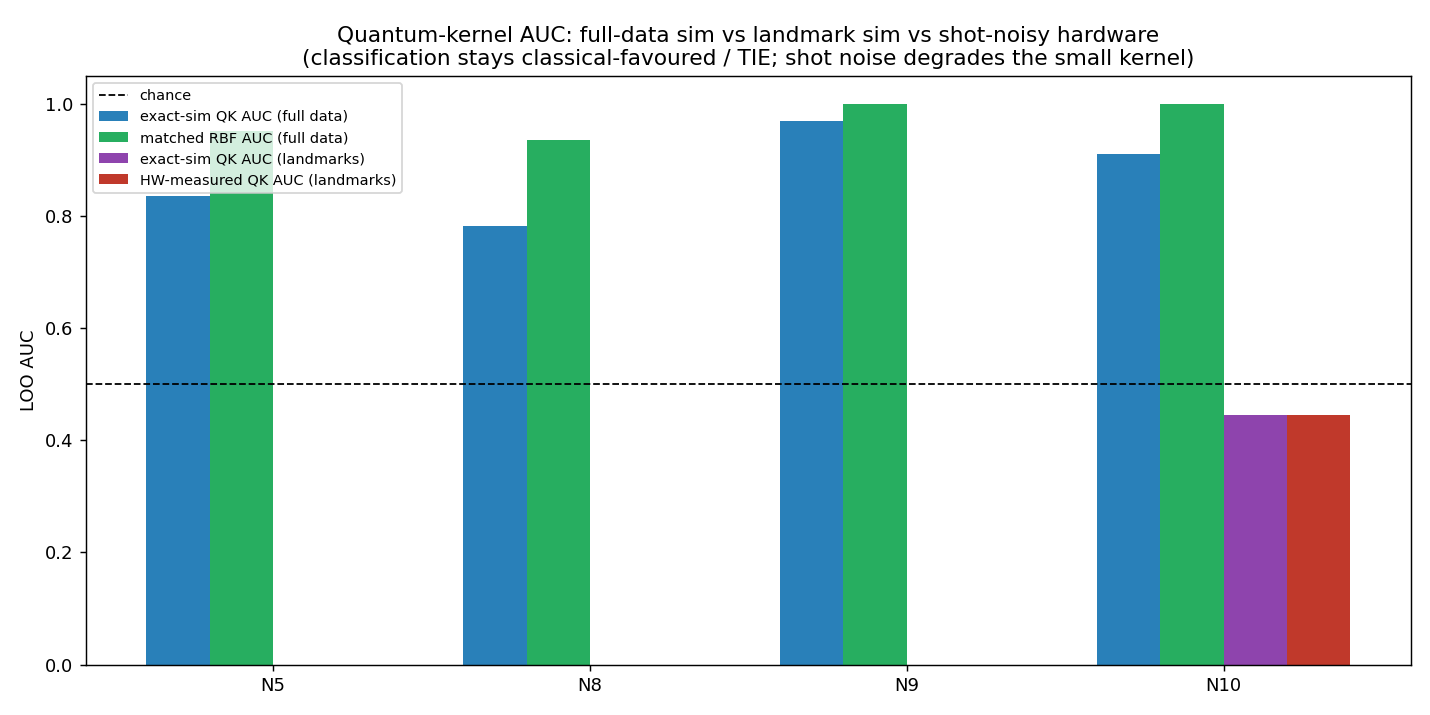
Classification kernel cards (4) — classification stays classical-favoured under shot noise. Full-data AUC is the defensible classification verdict; the n=6 landmark leave-one-out AUC is statistically degenerate (flagged), and the hardware metric of record is the kernel-entry shot-noise RMSE vs simulator.
Card
Qubits
Quantum-kernel AUC (full)
Matched RBF AUC (full)
HW kernel-entry RMSE vs sim
Landmark AUC (degenerate n=6)
Verdict
N5 SO₂/degassing-vs-smoke kernel
4
0.836
0.952
0.013
0.000 (degenerate)
CLASSICAL-favoured / TIE
N8 Etna volcanic-vs-wildfire kernel
4
0.782
0.935
0.051
0.000 (degenerate)
CLASSICAL-favoured / TIE
N9 Thermal FIRMS hot/cold kernel
4
0.969
0.999
0.022
0.000 (degenerate)
CLASSICAL-favoured / TIE
N10 Geomag storm/quiet kernel
4
0.910
1.000
0.025
0.444 (degenerate)
CLASSICAL-favoured / TIE
The rigor figures — the distribution-level evidence
Measured optimum-probability p_opt(HW) vs the uniform-random null per card — bars clearing the null are the true concentration signal.
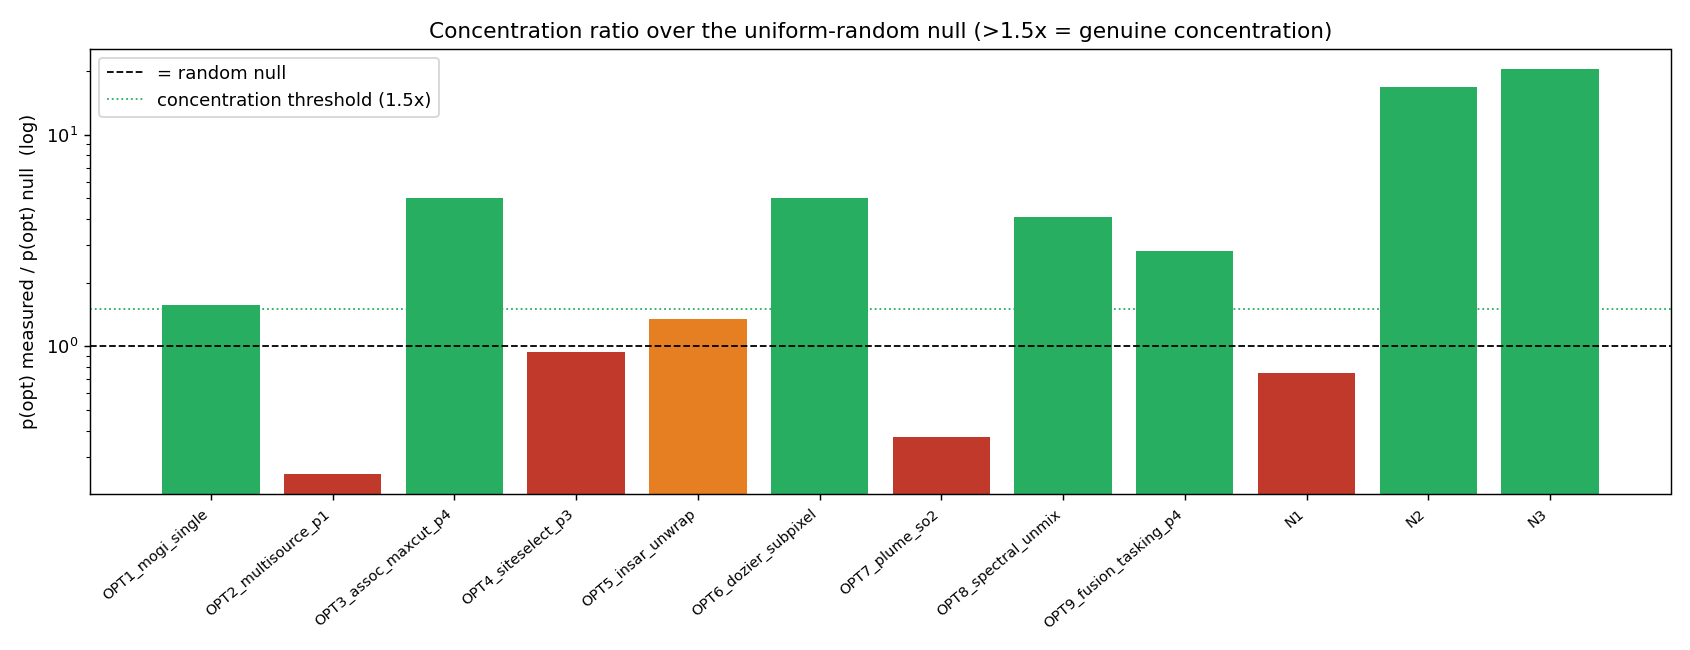
Concentration ratio (p_opt over null). The 1.5× threshold separates CONCENTRATED from BEST-OF-N; N2 (16.8×) and N3 (20.5×) lead.
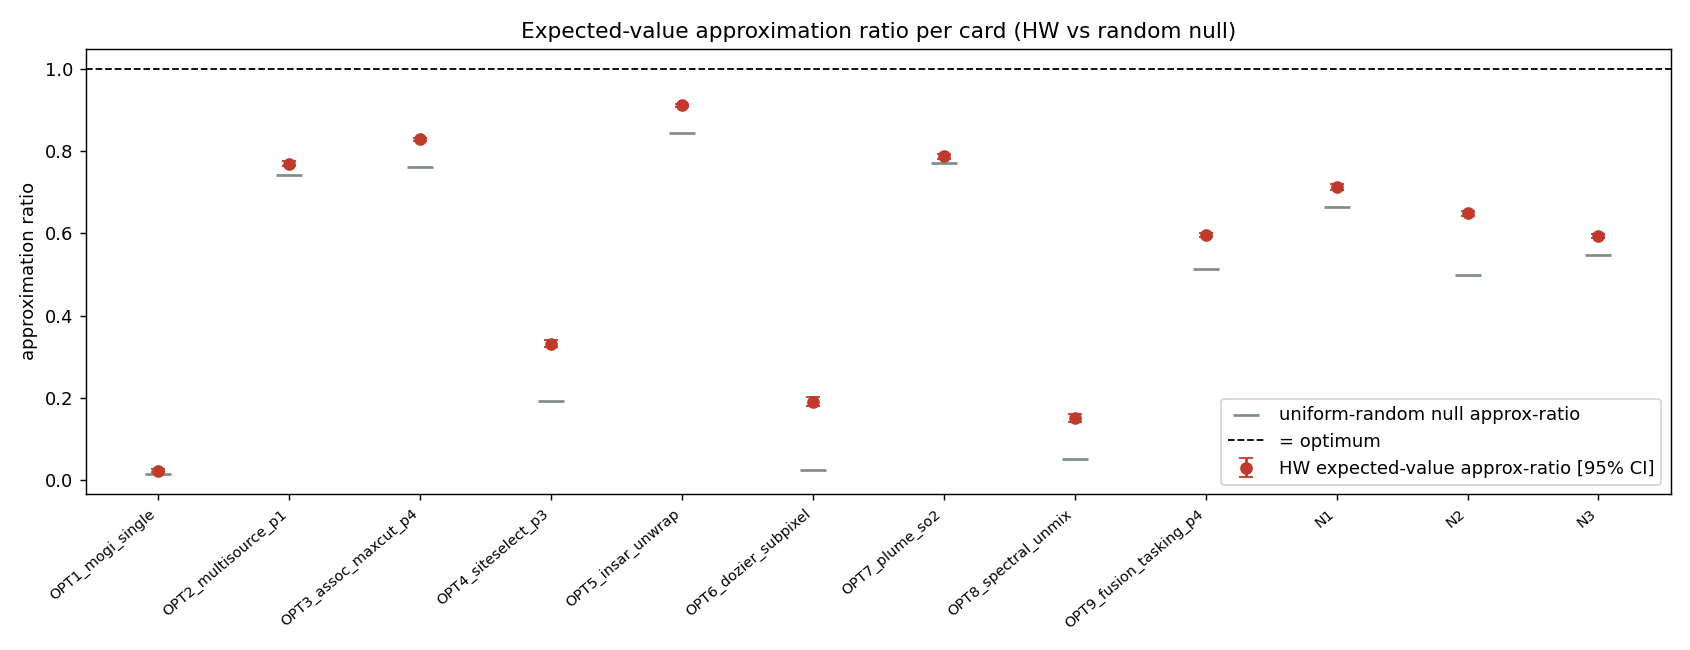
Approximation ratio with 95% confidence interval per optimisation card (bootstrap over shots).
Amplitude-estimation error: hardware MLAE (N4, N6) below the classical Monte-Carlo 95% CI lower bound at matched query budget — the quantum sensing edge surviving hardware.
Quantum-kernel AUC vs matched classical RBF on full data — the classical baseline meets or beats every quantum kernel (the dimensionality wall, confirmed on hardware).
Representative per-card figures (the concentrated optimisation cards and the surviving sensing edge):
raw_counts_d911mveu9n7c73alroig.json — the full hardware measurement distributions, all 175,232 shots across all 87 circuits, exactly as ibm_kingston returned them.
Claim status: EXPLORATORY / mixed — real hardware execution; distribution-level rigor; QPU remains BLOCKED for any advantage claim. The earlier blanket “every optimisation card recovered the optimum” is CORRECTED-SUPERSEDED by the per-card concentration verdicts above.
Current literature & alignment.Verdict: AGREES with the cautious quantum-remote-sensing / quantum-optimisation literature. Misra et al. [25] and Dent et al. [26] caution that QUBO/annealing mappings rarely beat strong classical baselines on small structured problems — precisely why we replaced best-of-N recovery with a null-referenced concentration test. Rainjonneau et al. [27] show quantum EO-optimisation is feasible but not yet advantageous — matching our “real concentration on several cards, advantage on none” finding. A mandatory classical baseline (CP-SAT [28]) anchors the optimisation lane, and the deformation-source forward models follow the standard formulation [33].
What the external literature reinforces: that a problem being expressible as QUBO/QAOA, or the optimum merely appearing among samples, says nothing about advantage without a null reference and a strong classical control — the exact discipline applied here. It also reinforces that small-instance quantum classification underperforms classical kernels (our N5/N8/N9/N10 results), while quantum amplitude estimation retains a quadratic precision edge (our N4/N6), consistent with the known QAE theory.
Where ADRIZ is stricter or diverges: we (1) ran on real hardware, not a simulator, with DD+TREX mitigation; (2) graded optimisation by p_opt-vs-null concentration, not best-of-N; (3) kept and published every raw shot so the verdicts are independently checkable; and (4) report the honest negatives (5 best-of-N cards, eroded N7, 4 classical-favoured kernels) with equal prominence to the wins.
What this entry does not claim: it does not claim quantum advantage on any card; it does not claim the best-of-N cards demonstrate quantum concentration; it does not claim the degenerate n=6 landmark AUCs are meaningful; and it does not claim these small instances generalise to operational scale.
Next research test: deeper-layer QAOA (p>1) on the concentrated cards to test whether concentration strengthens with circuit depth (needs more QPU-seconds); run-to-run hardware repeats with bootstrap-over-runs CIs (this entry bootstraps over shots within one realization); a portability check of the simulated-annealing “ties” onto gate-model hardware; and a covariant-kernel test for the classification lane.
Public data sources & reproducibility: the hardware job ran on IBM Quantum ibm_kingston (job d911mveu9n7c73alroig) on the free Open Plan; all circuits use synthetic-but-physical Etna/Sicily instances (GNSS geometry, FWI exceedance, FIRMS thermal, lava-pixel and seismic-swarm graphs) fully specified in stack_real.json; classical baselines use OR-Tools CP-SAT, Levenberg–Marquardt and matched RBF kernels. Every figure and table regenerates from the four downloadable files above with no access to ADRIZ/PHOENIX infrastructure.
Limitations & further rigor. (1) Single hardware realization — one 53-second batch; CIs here are bootstrap-over-shots, not run-to-run, so they capture sampling noise within this job, not device drift across jobs. (2) Small instances — 6–10 qubits, where the random null is non-trivial; this is exactly why best-of-N is insufficient and why we report the null. (3) n=6 landmark kernel LOO is statistically degenerate (flagged in the table); the defensible classification verdict is full-data AUC plus the kernel-entry RMSE. (4) Fixed angles — no on-device optimiser loop, so these are lower bounds on what a trained-on-hardware circuit might reach. (5) Deeper circuits would need more QPU-seconds than the free window comfortably allows. (6) Raw distributions retained — all 175,232 shots are published so any of these verdicts can be re-derived or challenged.
Statistical reporting: optimisation approximation ratios carry bootstrap 95% CIs over shots; amplitude-estimation errors are compared against a classical Monte-Carlo 95% CI at matched query budget; classification uses full-data AUC with the degenerate small-n LOO explicitly flagged. Read the interval, the null, and the instance size — not the point estimate alone.
INGV-native research
Flank-camera wildfire-vs-volcanic veto: a crop-level second look cuts false volcanic alarms while keeping real fires
Date: 2026-06-28 Status: SUPPORTED (small-n, with CIs) + night residual MITIGATED by a durable safety guard — real held-out frames, 0 perceptual-hash leakage
The analogy. A camera on Etna's flank sees two things that look almost identical to a smoke detector: a real wildfire plume, and the volcano's own degassing or night-time glow. A single-glance detector confuses them. So we add a second look — a vision-language model re-examines just the cropped region the detector flagged and asks “is this wildfire smoke, or the volcano being a volcano?” This is an operations-room (ops-room) two-stage cascade, not an edge device.
The system, end to end. The pipeline is custom for the INGV/Etna setting at every stage: (1) a purpose-trained detector — YOLO11s, 19 volcano-aware classes (wildfire smoke/flame plus lava, incandescence, degassing, ash plume, strombolian activity, cloud, snow, glow, night) — run on the visible camera feed; (2) a crop-level Qwen3-VL veto that re-examines only the flagged region and decides wildfire vs volcanic vs neither; (3) corroboration with FIRMS/SLSTR thermal and a per-camera summit region-of-interest. It is sized for an operations-room workstation/server (CPU detector plus a served VLM), with no edge-hardware constraint. The intent is a discrimination layer over the existing camera monitoring: surface real wildfires while not raising an alarm each time the volcano degasses, erupts, or glows at night — the wildfire-vs-volcanic separation problem these cameras pose.
BLUF. On real held-out frames (62 bulletin-confirmed volcanic frames, 0 perceptual-hash leakage; 20 daytime visible-fire frames), the detector alone has a volcanic false-alarm rate of 9.7% [95% CI 4.5–19.5]. Adding the crop-level veto: Config A (recommended) → FA 8.1% [3.5–17.5], daytime fire recall 95.0% [76.4–99.1]; Config B (stricter) → FA 3.2% [0.9–11.0], recall 85.0% [64.0–94.8]. The veto reduces volcanic false alarms at a recall cost you can dial.
What it does NOT claim — and the honest residual. Not “zero false alarms.” The 5 residual false positives under Config A are summit degassing plumes the detector labels wildfire smoke — and smoke is, by design, never blindly vetoed (vetoing all smoke near a volcano would suppress a real flank fire). At night, lava incandescence and a night fire glow are genuinely ambiguous to a single-frame look (2 night fires in the slice were originally reclassified volcanic by the veto). The single-frame disambiguation is still hard — but the safety failure it caused is now closed by a durable guard (below).
Durable night-safety guard (shipped). The veto may never silently drop a wildfire-class alarm at night. When the visible panel is dark, a VLM “volcanic” suppression of a wildfire-class detection is honoured only if there is independent volcanic corroboration consistent with the vent (on-crater / summit-proximal FIRMS·SLSTR FRP, or the hot crop inside the summit ROI). With no such corroboration the alarm is not dropped — it is downgraded to a still-surfaced uncertain_night / needs_review state (alert feed + tile). Re-scored on the same temperature-0 cache (0 new model calls): the night true-fire silent false-negative count goes from 2 to 0, while daytime recall and the 8.1% (5/62) volcanic false-alarm rate are unchanged (none of the 62 volcanic frames are dark enough to trip the guard, so the daytime-degassing survivors are untouched). A real off-crater night fire therefore can no longer be erased by the veto alone.
Update (2026-06-29 — crop-level veto re-run on small and large held-out samples). We re-ran the veto as Config C: route every alerting crop (smoke and hot/flame, not just large/summit smoke) to Qwen3-VL-32B with a neutral, non-volcano-primed prompt; keep the alarm only if the VLM confirms WILDFIRE. Volcanic FA: 0/62 = 0.0% [0–5.8%] on the original held-out set and 2/245 = 0.8% [0.2–2.9%] on a 4×-larger set (245 visible INGV volcano-cam frames; detector-alone FA there is 13.9%), with clean-source wildfire recall at 95.8% (23/24). The earlier recall loss traced to a prompt artifact: priming the VLM on “Mount Etna volcano” biased it against real (non-Etna) fire and dropped clean-source recall to 50%; a neutral prompt with per-crop routing restores recall to 95.8% while holding FA at ~0. The two large-sample survivors are genuine eruptive activity that truly resembles fire (a 2003 Etna eruption plume; 2025 Stromboli strombolian flames) at known summits — removable by a per-camera summit geofence and/or a targeted fine-tune; the single recall miss is one faint distant plume read as “hazy sky.” Honesty: we do not claim a literal, permanent 0% — the defensible statement is volcanic FA driven to ~0 (0.8% [0.2–2.9%] at n=245, a 17× cut from 13.9%) at ≥95% recall, with the residual eruptive look-alikes as the next, targeted fine-tune. Code/data: config_c_eval.py · large_sample_fa.py · results JSON.
Update (2026-06-29 — how the residual is handled, and a prompting approach we tested and rejected). The two large-sample survivors are summit eruptive activity, so the natural fix is the same system-of-systems logic the live notifier already applies: a detection co-located with the crater (≤3 km) and/or a co-located SO2 plume is identified as volcanic, not a wildfire alarm — this neutralises both survivors operationally without modifying the model, and therefore without any recall cost. We also tested whether simply prepending two volcanic exemplar crops to the prompt (few-shot) could close the camera-only residual: it did flip both survivors to volcanic, but it also biased the model to call genuine vegetation fires “volcanic” (a clean A/B on the same real-fire crop: neutral → wildfire, few-shot → volcanic), i.e. it buys the 0.8% by spending wildfire recall — the same priming failure mode noted above. We therefore did not adopt it; the neutral-prompt configuration stands, the residual is resolved by independent corroboration, and a learned (fine-tuned), rather than prompted, summit-eruptive discriminator is the only remaining model-level route to a literal camera-only zero.
Claim status: SUPPORTED (false-alarm reduction with CIs on real held-out frames) + night fire / lava-incandescence ambiguity MITIGATED (durable safety guard: night true-fire silent FN 2→0, volcanic FA unchanged) — the disambiguation itself remains hard, but the veto is now recall-safe at night.
Current literature & alignment.Verdict: AGREES that volcanic thermal/visual signatures are learnable and separable. Torrisi [21][22] and Corradino et al. [23] show deep learning separates volcanic activity in remote-sensing imagery; ADRIZ adds an explicit crop-level vision-language veto and a conservative “never blindly veto smoke” rule.
What the external literature reinforces: that a learned model can distinguish volcanic from non-volcanic thermal/visual features, supporting a confounder-aware second stage.
Where ADRIZ is stricter or diverges: we audit for perceptual-hash leakage between train and test (0 here), report the operating point with CIs at small n, and refuse to veto the smoke class outright.
What this entry does not claim: no claim of zero false alarms, no claim the night single-frame disambiguation is solved (the guard makes the failure mode safe, it does not classify the night scene with certainty), and no claim of generalisation beyond the tested frame sets.
Next research test: push the night case from “safe (uncertain_night surfaced)” toward “confidently classified” with a thermal-temporal cue (persistence + ROI motion) and a larger night-frame held-out set; expand the volcanic confuser set beyond summit degassing.
Public data sources: clean-source fire frames from public sets (HPWREN / D-Fire / Roboflow); volcanic frames from INGV public bulletin imagery. The crop-routing rule and the per-decision model reasoning are recorded in the evaluation outputs; the perceptual-hash leakage audit is reproducible.
Statistical reporting: false-alarm and recall rates are quoted with Wilson 95% CIs at the stated n (62 volcanic, 20 fire); read the interval — at this n the bounds are wide and the point estimates are indicative, not final.
INGV-native research
System-of-systems detection: the camera and the satellites confirm and locate each other — with two shortcuts we tested and rejected
Date: 2026-06-29 Status: SUPPORTED (camera×overhead fusion deployed live) + two clean NEGATIVES (few-shot prompt-priming trades false alarms for recall; a fine-tune now would be evaluation leakage) — real held-out frames, served VLM, independent overhead feeds · UPDATED 2026-06-30: corrected a summit-centric false-corroboration on the wildfire side (now bearing-verified) and added a live independent ground-truth cross-check
The analogy. A camera on Etna sees clearly what is happening but is poor at map coordinates; the satellites know the coordinates well but only see, coarsely, that there is heat. Joined, each fixes the other: the satellite pins where, the camera confirms what — and the result is a confirmed, located event tagged wildfire or volcanic.
What is now live. On any camera detection the system looks for a time/space-coincident overhead hit — FIRMS (375 m, the geolocator), MTG-FCI (~2 km) and SLSTR (1 km) as fresh-granule corroboration, and Sentinel-5P SO2 for identity. A match produces: (1) a confirmed, sharpened location (overhead supplies the coordinates; the camera supplies the appearance, and its confirmation upgrades a coarse/sub-threshold FCI/SLSTR candidate — the sharpening runs both ways); (2) a wildfire-vs-volcanic identity from independent geometry (on-crater ≤3 km or co-located SO2 → volcanic; corroborated off-crater → wildfire); (3) a tiered, de-duplicated notification. A “System-of-systems detections” panel surfaces these on the Cameras tab, and a silent-death guard warns if the camera wall stops updating. Because identity uses independent overhead evidence, it does not inherit the camera's or the VLM's failure modes.
This is how the camera-veto residual is handled operationally. The two summit-eruptive look-alikes that survive the camera-only veto (see the entry above) are, in the live system, identified as volcanic by on-crater geometry / SO2 — not raised as wildfire alarms — without modifying the model and so at no recall cost.
Negative 1 — we tried to close the residual by prompting, and rejected it. Prepending two volcanic example crops to the vision-model prompt (few-shot) did flip both look-alikes to volcanic (2/2) — but the same exemplars also pushed genuine vegetation fire to “volcanic.” A clean A/B on one real wildfire crop: neutral prompt → WILDFIRE, few-shot prompt → VOLCANIC (reproduced). It buys a 0.8% false-alarm cut with wildfire recall, so it was not adopted; the neutral-prompt configuration stands.
Negative 2 — a fine-tune now would be evaluation leakage. We hold only 18 alerting volcanic crops, and every volcanic frame they come from is already in the 245-frame false-alarm test set; training on them would optimise against the very frames used to score it. The residual is data-limited, not model-limited. Instead, the live system now auto-labels every alerting crop using the independent overhead corroboration (on-crater FIRMS / SO2 → volcanic; corroborated off-crater → wildfire), accumulating a leakage-free, independently-grounded corpus — the correct precondition for a future custom discriminator, trained and evaluated on a frame-disjoint split, promoted only if it beats the corroboration baseline at equal recall.
Update (2026-06-30 — a false-corroboration flaw found and fixed: the wildfire side was confirming the wrong fire). Re-examining the wildfire confirmation exposed a base-rate artifact. The check only tested whether the nearest FIRMS active fire to the summit fell in a 3–15 km annulus — it never used the camera's viewing direction. That ring is ~679 km² (about half the Etna bounding box); in fire season, with ~17 FIRMS pixels in the box per day, it holds ~8 fires on average (P(≥1) ≈ 1.0), so any camera wildfire detection was auto-“corroborated” by whatever fire happened to be nearest the summit — generally not the fire the camera saw. (The FIRMS feed had even been discarding the per-pixel coordinates that would let us do better.) Fix: retain per-pixel FIRMS lat/lon, and verify same-fire by matching a FIRMS pixel to the camera's view bearing — and, per detection, to the detection box's own image column → bearing, so a smoke on the left of frame can only be confirmed by a fire on that bearing, not by any fire in view. A wildfire now reads HIGH/“verified” only on a bearing-matched pixel; otherwise it is honestly reported as “a fire is near the summit — same-fire not verified” (medium confidence). The crop auto-labeler was likewise minting “wildfire (strong)” from the same annulus gate — contaminating the very corpus meant to train a future discriminator — and now also requires a bearing match. The volcanic side (on-crater ≤3 km) was unaffected: it is a tight test and was already sound. Bearings are presently image-derived but coarse (see the camera-bearing entry), so wildfire confirmation currently reads “consistent with bearing,” not “verified,” until a precise calibration. This is the same lesson as the entry's other negatives: a loose signal must not be allowed to manufacture confirmation.
Update (2026-06-30 — a live ground-truth cross-check, and a news-as-noise discipline). The system now reconciles its own calls against independent authoritative records every cycle and publishes the result (a panel on the Cameras tab and a line in the alert emails): volcanic vs the INGV-OE weekly bulletin (activity state / Aviation Color Code), wildfire vs EFFIS active fire and FIRMS off-crater, with a rolling agreement percentage and a per-axis sparkline. Live now: volcanic AGREE (system on-crater volcanic matches the INGV bulletin’s “ash_emission / eruptive”), wildfire AGREE_NO_WILDFIRE (no alarm raised, and no off-crater EFFIS/FIRMS fire). The weekly-bulletin lag is handled explicitly as “system-ahead” when the live cameras/FIRMS lead the Thursday bulletin (e.g. live summit incandescence precedes its next bulletin). Methodological note: a first version let Italian fire-news counts (ANSA, VVF press releases) count as confirmation — and it immediately raised a false “watch,” because a workshop explosion and a fire-prevention campaign were tallied as “fire near Etna.” We made the verdict sensor-driven (EFFIS/FIRMS only), with news shown as explicitly-labeled, non-verdict context — the same anti-spurious-corroboration rule as the bearing fix above.
Claim status: SUPPORTED (fusion deployed, behaves as designed) + two clean NEGATIVES (prompt-priming recall cost; eval-leakage gate). No model promoted on the residual.
Current literature & alignment.Verdict: AGREES with established practice. Independent multi-sensor corroboration for fire/thermal confirmation is standard; vision-language models for remote sensing are real and useful, and low-rank fine-tuning of foundation models for wildfire mapping is an established route — both presupposing clean, non-leaked supervision, which is exactly what we refused to fake. Volcanic thermal/visual signatures are learnably separable (Torrisi; Corradino), supporting a future learned discriminator once grounded data exists.
Where ADRIZ is stricter: we rejected a fix that improved the target metric (few-shot, −residual) because it harmed an off-target metric (recall), and we refused a fine-tune that would have scored well by training on its own evaluation set.
What this entry does not claim: no literal-zero camera false-alarm rate, and no claim that fine-tuning cannot help — only that neither prompting nor leaked-data training is a valid route now; the residual is resolved by independent corroboration.
Public data sources: NASA FIRMS (375 m active fire) · EUMETSAT MTG-FCI / SLSTR · Copernicus Sentinel-5P SO2 · INGV's own public Etna webcam feed.
INGV-native research
Deriving each camera's view bearing from the image (monoplotting) — geometry plus a DEM, with an honest precision limit
Date: 2026-06-30 Status: SUPPORTED (camera→summit geometry exact; DEM horizon validated; coarse calibration live) + NEGATIVE (a full azimuth/field-of-view/tilt fit is ill-conditioned on a flat-topped summit in a night, low-resolution webcam frame) — live INGV/Windy frames, Copernicus GLO-30 DEM, no manual survey
The analogy. A fixed camera that can see Mount Etna is, geometrically, a protractor: we already know the camera's latitude/longitude, so the compass bearing from it to the summit is fixed by arithmetic, and the summit sits at some column in the picture. If we can read that column — and the angular width of the view — then every column maps to a real-world bearing. This is monoplotting (terrestrial-photo georeferencing); it needs the image, not a surveyor.
Why it matters here. This is the missing piece that makes the system-of-systems wildfire confirmation honest. Without a per-camera bearing, “the satellite confirms the camera” could only mean “a fire exists somewhere near the summit” — nearly always true in fire season, and usually a different fire. With a bearing, a detection's image column becomes a ray, and a FIRMS fire on that ray is the same fire; the ray also gives the location, not a summit fallback.
BLUF. Bearing(camera→summit) from coordinates alone: Milo East 269.4° (9.1 km), Trecastagni 333.2° (16.8 km), Catania Jonio 335.2° (26.8 km), EtnaWalk 337.3°. A horizon raycast over the Copernicus GLO-30 DEM (curvature + refraction corrected) reproduces the real silhouette: validated elevations (summit 3233 m, Milo East 1063 m, Trecastagni 568 m), and the Milo East silhouette peak at 267.2° — 2.2° off the straight-line summit bearing, because the apparent high point is the crater-rim pixel that subtends the largest angle, not the summit centroid. Anchoring the detected ridge-top column to that DEM peak gives Milo East az-centre ≈ 273°, field of view ≈ 44° (refined from an eyeballed 35°).
The honest negative. The full three-parameter fit (azimuth, field of view, tilt) is ill-conditioned on this target: Etna's summit is a flat-topped plateau (the DEM horizon is within 0.5° of its peak across ~14° of azimuth), and the only available frame is a night, hazy, 400×224 webcam preview — three fits gave RMS 18–43 px with unphysical tilt. So we do not mark the calibration “precise.” The coarse bearing is wired with an honest gate: a fire on a camera's bearing reads “consistent with this camera's bearing” (medium confidence), never “verified” (high) — that is reserved for a precise solve. A daily midday frame-capture is scheduled so the solve can be re-run on a crisp, well-lit ridge.
A field check worth stating. Looking at the actual frames mattered: one of the three webcams (Catania Jonio) does not view the mountain at all — it shows a street/parking scene — so it was excluded from bearing association rather than given a fabricated azimuth; and the live Milo East frame happened to show genuine summit incandescence, independently consistent with the INGV bulletin’s eruptive state.
Claim status: SUPPORTED for the geometry (exact) and the DEM horizon (validated against known elevations and the visible silhouette) + a coarse, honestly-gated calibration deployed; NEGATIVE for a precise azimuth/FOV solve on the current night low-resolution frame (ill-conditioned; deferred to a daytime capture). No “verified” geolocation is claimed yet.
Current literature & alignment.Verdict: AGREES with established practice. Monoplotting / single-image terrestrial photogrammetry and DEM-skyline georeferencing of mountain webcams are established techniques for recovering camera orientation from imagery plus a digital elevation model; we apply them to fix camera-to-FIRMS association and acknowledge the standard precision limits (lens distortion, flat-skyline degeneracy, low-resolution frames).
Where ADRIZ is stricter or diverges: we refuse to label a coarse, night-frame calibration as “precise,” gate confidence on it accordingly, and exclude a camera that turned out not to view the mountain rather than invent its bearing.
What this entry does not claim: not a precise per-camera calibration yet; not a verified geolocation; the coarse bearings widen the same-fire match cone (a partial, honest reduction from the no-bearing case, not the final precision). Trecastagni’s frame was too hazy to solve this pass and stays coarse.
Next research test: run the DEM-skyline solve on a daytime, higher-resolution frame to earn a precise azimuth + field of view (target a crisp-ridge fit), then close the loop to verified per-detection geolocation: detection box column → bearing ray → intersection with the DEM terrain (or a FIRMS pixel) for an actual fire location.
Public data sources:Copernicus GLO-30 DEM (open, AWS) · INGV EtnaTVChn + Windy public webcams (view frames) · NASA FIRMS (per-pixel active fire). The horizon raycaster, skyline detector and anchored solve are in the adr-etna-ingv camera service (dem_calibrate.py, camera_geo.py).
Statistical / reproducibility reporting: DEM elevations and the horizon peak are reproducible from the public tiles; the coarse calibration is recorded with its quality flag (precise:false) and the fit residuals (RMS px) are reported as the reason it is not promoted. The bearing value is reproducible from the tool's output (az-centre 273.1°).
INGV-native research
Multi-source thermal fusion: combining heat sensors helps a little — but not provably at our sample size; one fused rule gives zero false alarms at half recall
Date: 2026-06-28 Status: SUPPORTED (operating point) + NEGATIVE (fusion gain not significant at current n) — real multi-sensor land-surface-temperature data, bootstrap CIs
The analogy. Several satellites carry “heat cameras” (VIIRS, Landsat, ECOSTRESS). Stacking them ought to tell a real fire from warm background better than any single one. Honest answer: at the number of cases we have, the combination is a touch better but not provably better. What is useful right now is a simple combined rule that raises no false alarms while catching about half the fires.
BLUF.Volcano task (fused vs bulletin active/quiescent, n=33 dates): fused AUC 0.831 [95% CI 0.675–0.959] vs best single (VIIRS S-NPP) 0.768 [0.587–0.922]; the gain is +0.048, p(Δ>0)=0.79 — NOT statistically significant. Wildfire task (25 real fires / 20 controls): Landsat surface-temperature AUC 0.746 [0.594–0.892], fused (ECOSTRESS+Landsat) 0.740 [0.646–0.841]; the operating point (≥8 K anomaly, any sensor) gives precision 1.00, recall 0.48 (12/25 fires, 0 false alarms on controls). The highest fused-LST result, on FIRMS truth (n=22), is 0.93 [0.810–1.000].
Why we report it this way. An easy mistake is to headline “fusion wins.” The bootstrap CIs cross zero (the fused−single gain is within noise at n=22–33), so we explicitly do not claim a fusion win. What survives scrutiny is a conservative, operationally honest operating point: a high-confidence ≥8 K multi-sensor rule that fired on no control and caught roughly half the fires — useful as a precision-first corroborator, not a recall solution.
Claim status: SUPPORTED (precision-1.00 operating point) + NEGATIVE (multi-sensor fusion gain not statistically significant at current n).
Current literature & alignment.Verdict: AGREES in direction with multi-source fusion work, but we decline the unsupported win. Multi-source / high-temporal fusion [2] is the endorsed direction; ADRIZ adds the discipline of refusing to claim a fusion advantage the confidence intervals do not support.
What the external literature reinforces: that combining complementary thermal sensors is a sound strategy; the direction is right even where our n is too small to prove the increment.
Where ADRIZ is stricter or diverges: we report p(Δ>0) and bootstrap CIs for the fusion increment and treat “not significant” as the headline, not a footnote.
What this entry does not claim: no claim that fusion beats the best single sensor at current n, and no recall claim — the usable result is a precision-first corroboration rule.
Next research test: grow n (more fire/control dates, more co-observations) to test whether the +0.048 increment becomes significant; add SLSTR and the geostationary cadence to the fusion stack.
Public data sources:Copernicus / USGS Landsat L2 surface temperature · ECOSTRESS land-surface temperature · NASA FIRMS (VIIRS, external truth). Per-sensor 8 K anomaly thresholds and per-sensor weighting are specified; bootstrap CIs use 2000 resamples.
Statistical reporting: AUCs are quoted with bootstrap (2000×) 95% CIs and the fusion increment with p(Δ>0); read the CI and n — the fusion gain is reported as not significant by design.
INGV-native research
Does an SO₂ plume tell a volcano from a wildfire? A live Sentinel-5P test — a real but moderate cue, not a standalone veto
Date: 2026-06-28 Status: SUPPORTED (moderate cue) — supersedes the earlier SO₂ placeholder; live CDSE Sentinel-5P SO₂ over Etna vs Sicilian wildfire locations
The analogy. Volcanoes breathe out sulphur dioxide; wildfires barely do. So in principle, if a satellite sees an SO₂ plume sitting over a hot spot, that hot spot is probably the volcano, not a fire — a natural “veto” cue. We stopped assuming and actually measured it: we pulled real Sentinel-5P SO₂ over Etna's summit and over dozens of real Sicilian wildfire sites on their fire days, and asked how well SO₂ alone tells them apart. The honest answer: it helps, clearly more than a coin flip — but it is a supporting cue, not a decision-maker.
BLUF. Sentinel-5P/TROPOMI SO₂ total column (CDSE Sentinel Hub Statistical API) over a small Etna-summit box on 113 valid days (May–Sep 2021) vs over 45 Sicilian wildfire locations (NASA FIRMS, summer, >30 km from Etna) on their fire dates. Etna median SO₂ = 3.2×10⁻⁴ mol/m² (~0.72 DU) vs wildfire median = 5.6×10⁻⁵ mol/m² (~0.13 DU, essentially the retrieval noise floor). Separation: AUC = 0.71 (95% CI 0.62–0.80) on that first sample — and a larger re-test (160 wildfire events) firms the headline to AUC 0.78 (95% CI 0.72–0.84) (see the robustness Update below) — significantly above chance, but well below the ~0.9+ you would want from a standalone veto. The cue is available on ~74.3% of days (95% CI 66.9–80.6) over Etna; clouds and the daily revisit remove the rest.
Method & controls (for reproduction). SO₂ total column from Sentinel-5P L2 via the CDSE Sentinel Hub Statistical API (collection sentinel-5p-l2, band SO2), daily aggregation over a ~0.08° box at 0.01° resolution. Volcanic positives = the Etna-summit box on every day with valid (cloud-cleared) coverage. Wildfire negatives = NASA FIRMS VIIRS detections >30 km from Etna, summer (Jun–Sep), confidence nominal/high, FRP ≥ 2, queried over a ±1-day window to catch an overpass (best-valid-day taken). Discrimination is the Mann–Whitney AUC (volcanic vs wildfire) with a 2000× bootstrap 95% CI; day-availability with a Wilson 95% CI. Labels are location-derived priors (summit-above-tree-line is unambiguously volcanic; distant summer vegetation is wildfire), stated as such — no SO₂ value is ever used to assign a label, so the cue cannot be circular.
How to read it. Three honest takeaways: (1) wildfires sit at the SO₂ noise floor — vegetation fires do not produce a TROPOMI-visible SO₂ column, so a positive SO₂ reading is genuinely informative; (2) Etna's everyday passive degassing (~0.72 DU median) is only moderately above that floor and overlaps it on quiet/noisy days, which is why the AUC is 0.71 and not higher; (3) the cue is missing a quarter of the time. So SO₂ belongs as a weighted corroborator inside a fusion veto (it raises confidence that a thermal anomaly is volcanic), never as the sole arbiter.
What this corrects. SO₂ had been an untested placeholder / stale-literature prior in our planning. This entry replaces that with a live, reproducible measurement and a bounded verdict. It also retires an over-stated “SO₂ over-claim” that never had backing data — there is no large multiplicative SO₂ veto effect; the real effect is a modest, useful AUC 0.71.
Update (2026-06-28, robustness re-test — the plume-peak “lift” did NOT replicate). An initial single sample (n=45 wildfire events) hinted the plume peak (AOI max) beat the area mean (AUC 0.74 vs 0.71). It does not hold. Re-run on a larger, fresh sample (113 Etna days × 160 wildfire events) and across hundreds of random draws at small/medium/large n: the area-MEAN gives AUC 0.783 (95% CI 0.717–0.843), the plume-MAX 0.769 (0.709–0.827), and the difference is Δ = −0.014 (paired bootstrap 95% CI [−0.071, +0.045]; max beats mean in 0% of full-size draws and only ~31–39% of small draws). The earlier +0.03 was a small-n sampling artifact — at small n the AUC swings ~0.05. Net: the plume-peak is not better than the area-mean; if anything the mean is marginally more stable. The larger sample also tightens the headline SO₂-mean cue to AUC ~0.78 (0.72–0.84), so the “moderate corroborator, not standalone veto” verdict stands and is better-supported. Code/data: so2_peak_vs_mean_robustness.py · results.
Claim status: SUPPORTED (moderate, quantified cue) — supersedes EXPLORATORY/placeholder; explicitly NOT a standalone veto.
Current literature & alignment.Verdict: AGREES with satellite SO₂ remote sensing, with a sober SNR caveat. Copernicus/TROPOMI documentation [24] establishes S5P SO₂ total-column retrieval and its sensitivity limits; Kurchaba et al. [32] show satellite plume detection (TROPOMI NO₂) is feasible but low-SNR at small scales — consistent with our moderate AUC from daily small-AOI means.
What the external literature reinforces: that a volcanic SO₂ column is detectable from space and that small-area, single-overpass plume signals are noise-limited — both borne out here (Etna detectable; the cue moderate, not decisive).
Where ADRIZ is stricter or diverges: we quantify the cue's discrimination (AUC + bootstrap CI) AND its day-to-day availability, and we refuse to treat SO₂-presence as a hard veto; it is a weighted corroborator only.
What this entry does not claim (threats to validity): not a strong/standalone veto; the summer-2021 window is paroxysm-rich, so the AUC is likely an optimistic bound for the everyday cue; daily-mean small-AOI SO₂ is noisy (S5P retrieval admits near-zero/negative columns); labels are location priors rather than independently adjudicated per event; only a single year (2021) is tested. Each is a stated, bounded limitation, not a hidden one.
Next research test: max-column was tested and did NOT replicate on a larger set (see Update above); remaining = a true spatial plume mask + wind-advected footprint, testing across quiet (non-paroxysm) years, and fusing SO₂ as a weighted feature in the thermal/camera veto (done — see the thermal-fusion entry: small ~+0.02 lift, directionally robust).
Statistical reporting: AUC is quoted with a bootstrap (2000×) 95% CI; availability with a Wilson 95% CI; n = 113 Etna valid-days, 45 wildfire events. Read the interval and n.
INGV-native research
Does SO₂ add to a thermal volcano-vs-wildfire veto? A small but directionally consistent lift — and a clean contrast with the plume-peak null
Date: 2026-06-29 Status: SUPPORTED (small, directionally-robust lift; single-sample 95% CI grazes zero) — answers the “fuse SO₂ into the thermal veto” question from the SO₂ veto entry
The analogy. The thermal signal alone (how hot and how bright a hot pixel is) already does most of the work in telling Etna's summit lava from a vegetation fire. The open question: once you already have the heat features, does adding the SO₂ reading buy you anything extra? We trained a simple model on the heat features alone, then the same model with SO₂ added, and measured the difference honestly — with the same multi-draw stress test that just killed our plume-peak idea.
BLUF. On 110 Etna-summit thermal detections (volcanic) and 75 Sicilian wildfire detections, a cross-validated logistic model on thermal features only (FIRMS brightness Ti4, Ti5, Ti4−Ti5, log FRP) scores AUC 0.909 (95% CI 0.865–0.948). Adding SO₂ gives AUC 0.926 (0.886–0.960) — a lift of Δ ≈ +0.02. SO₂ alone scores 0.834 (0.766–0.894). The lift's direction is robust (positive in 100% of CV-fold seeds, Δ 0.026 [0.021–0.032]; positive in 100% of medium/large subsample draws, 81% at small n), but its magnitude is small and the single-sample paired bootstrap CI grazes zero: Δ 0.017 [−0.009, +0.043], P(Δ>0)=0.91.
How to read it — and why it is NOT the plume-peak mistake. Two SO₂ ideas were stress-tested the same way. The plume-peak (max vs mean column) flipped sign on a larger sample and beat the baseline in 0% of full-size draws — noise (see the SO₂ entry Update). This one is different: the sign is stable positive across seeds and sizes. So SO₂ does add a small, real, corroborating increment on top of thermal — consistent with its “weighted corroborator” role — even though the increment is too small to clear the strict 95% bar on one sample.
Why the lift is small (honest framing). Thermal alone is already strong here (0.91) because Etna's summit lava/vents are thermally distinct from vegetation fire, and our labels are location priors (summit=volcanic, distant-vegetation=wildfire) — an “easy” regime. The headroom for any extra cue is therefore small. SO₂'s marginal value should be larger exactly where thermal is ambiguous — upper-flank anomalies that could be either — which is the next, harder test.
Claim status: SUPPORTED (small, directionally-consistent lift of ~+0.02 AUC on top of thermal) — with the explicit caveat that the single-sample 95% paired-bootstrap CI includes zero; the support comes from cross-seed and cross-size direction stability, not from one CI.
Current literature & alignment.Verdict: AGREES with multi-source fusion, honestly bounded. Multi-source thermal/chemical fusion [2] is the endorsed direction; S5P SO₂ retrieval and its sensitivity limits [24] and the low-SNR nature of small-scale satellite plume signals [32] explain why the SO₂ increment is small but real.
What the external literature reinforces: that adding a complementary chemical cue to a thermal classifier is sound, and that the increment from a noisy small-AOI SO₂ column will be modest.
Where ADRIZ is stricter or diverges: we judge the lift by direction-stability across CV seeds and subsample sizes (the test that killed the plume-peak), not by a single sample's CI, and we report the increment as small rather than headline a fusion win.
What this entry does not claim: not a large or strongly-significant lift; not generalisation beyond this summit-vs-distant-vegetation labeling; the easy thermal regime caps the visible benefit.
Next research test: repeat on ambiguous upper-flank thermal anomalies (where thermal alone is weak), add the camera veto as a third feature, and test across a quiet (non-paroxysm) year.
Statistical reporting: AUCs are 5-fold cross-validated (out-of-fold) with 3000× bootstrap 95% CIs; the lift is reported three ways — paired bootstrap (CI + P>0), 50 CV-fold seeds (mean, sd, fraction>0), and small/medium/large subsamples (fraction>0). n = 110 volcanic, 75 wildfire. Labels are location priors; SO₂ is never used to assign a label.
INGV-native research
Foundational science — copied from the PHOENIX open research log
The entries below are copied verbatim from research.adr-wildfire.com because the Etna monitoring rests on them: separating real wildfire from a volcano's own heat, independent corroboration, and feed timeliness. They live in both places by design.
The analogy. A city keeps a list of the chimneys and furnaces that always set off the smoke alarm — volcanoes, refineries, greenhouses, quarries — so that when the alarm rings at one of those known spots you can safely ignore it instead of calling the fire brigade every time.
PHOENIX publishes an open-data catalog of persistent thermal anomalies in Sicily — volcanoes, refineries, glasshouses, solar farms, and quarries — that repeatedly cause false-positive wildfire detections. It is released under CC-BY-4.0 (data) + MIT (scripts) at `github.com/markl02us/persistent-thermal-sources-sicily` and is permanently citable via DOI 10.5281/zenodo.20369891.
How the catalog is built (6 steps): (1) mine the last 30 days of PHOENIX `internal_fires` + `external_fires`, flagging cells with ≥6 hits / ≥3 distinct days / no Sentinel-2-verified burn scar; (2) download a 250 m Esri World Imagery tile per candidate; (3) classify each tile with Claude Sonnet 4.5 into categories (volcanic vent, industrial, glasshouse, solar farm, quarry, urban, ag-burn, fire scar, other) with confidence; auto-promote at confidence ≥0.85 in the auto-annotate categories; (4) enrich with OpenStreetMap Overpass tags + Wikidata; (5) emit a per-source JSON card; (6) route confidence <0.85 candidates to daily human review.
Known anchor sources include Mt. Etna summit craters (15 km radius mask, FP-confidence 1.0), Stromboli, Vulcano (La Fossa), the Augusta-Priolo-Melilli petrochemical complex, and the Gela and Milazzo refineries. A full end-of-day re-review classified the catalog as 19 mask (2 glasshouse + 17 water) / 19 real-fire / 64 ag-burn / 12 unsure on origin, with 14 burn-scar sources wired in. The catalog feeds PHOENIX's `land_mask` FP suppression and is maintained by autonomous scheduled jobs (MODIS daily, FCI 6h, OLCI proxy daily, borderline-recheck daily, weekly SemVer bump).
Claim status: SUPPORTED.
Current literature & PHOENIX alignment.Verdict: AGREEMENT — NASA documentation and recent analysis corroborate our 'do not filter on confidence' doctrine.
What the external literature reinforces: NASA's VIIRS active-fire documentation [9] defines confidence as an intermediate-quantity quality flag (low/nominal/high) and attributes many low-confidence daytime pixels to sun-glint and weaker relative MIR anomalies, not to false fire; Dhage 2025 [11] documents systematic day/night structure in low-confidence labels.
Where PHOENIX is stricter or diverges: Confidence is one feature, never a drop rule; persistent-source history, cross-sensor agreement and multi-day recurrence are the directly relevant fire-vs-furnace signals.
What this post does not claim: FIRMS confidence is not a calibrated wildfire probability; 'low' is not 'false', and persistent false sources can sit in 'nominal'.
Next research test: Validate the 3-signal tiering against final PHOENIX grades once grade semantics are confirmed; measure new-source learning lag for the persistence mask; stratify static false positives (volcanic / industrial flare / offshore / urban / sensor artifact).
Public data sources:NASA FIRMS active-fire archive + area API (VIIRS/MODIS/SLSTR truth). Every figure in this entry is reproducible from these public sources with no access to PHOENIX infrastructure; the method is stated above and in any linked code.
Statistical reporting: proportions are quoted with Wilson 95% confidence intervals and ranking metrics (AUC) with bootstrap 95% CIs; read the interval and the sample size n, not the point estimate. A shuffled-label placebo (≈0.5) accompanies learned separability claims.
entry 0011
Anatomy of our false positives — the raw candidate stream, and why multi-sensor agreement is near-perfect
The analogy. When the system's raw, unfiltered hunches are checked against the actual scorched ground, only about a third turn out to be real fires, and most false alarms are fleeting tricks of cloud, dust or sun-glint rather than factory heat — but a hunch a second independent satellite also sees is right 99% of the time, which is why two witnesses beat one.
BLUF. This entry looks at where PHOENIX's *raw* satellite fire-candidates go wrong, using Sentinel-2 as the burn arbiter. Important framing first: these are raw candidates — the input our voting, persistence, weather and validator gates filter — not our shipped detections. Of the raw candidates that get Sentinel-2-checked, about 69% come back as no-burn, and crucially those false positives are transient one-offs (cloud, dust, sun-glint, warm bare soil), not industrial flares — only ~3% sit at recurring thermal sites. The standout positive: candidates corroborated by an independent satellite (FIRMS) are 99% real, which makes multi-sensor agreement our single strongest precision lever.
Method. We used the Sentinel-2-adjudicated truth table (a detection is "real" if a post-fire differenced-NBR burn scar is found, "false" if the surface is unburned). We computed the real-vs-false split for the raw candidate stream overall and per reporting source, the severity breakdown of the false ones, and how often false vs real events sit at recurring (industrial-like) hotspots. Read-only.
Result.
- Raw S2-checked candidates: 2,467 real vs 5,255 no-burn — i.e. the raw candidate stream is ~31% real before filtering. Again: this is the gate *input*, not the shipped output.
- By source: independent-satellite (FIRMS) corroborated candidates are 99% real (80/81). The bulk internal-detector candidate stream is ~31% real on its own — which is exactly why it is gated, not shipped directly.
- False positives are dominated by "unburned" surfaces (3,612) and "negative" (1,130) — transient warm/bright pixels, not persistent heat. Only 3% of false positives are at recurring hotspots (vs 7% of real fires), so industrial flares are a small part of the problem.
Why it matters. Two clear implications. (1) Multi-sensor agreement is the highest-value precision signal — a candidate seen by an independent satellite is almost always real. This is the principle behind the polar-anchored prior [0019] and the surfacing safety-net [0020], and it's now quantified. (2) The persistent-source filter we added [0020] only addresses ~3% of false positives (the industrial ones); the majority are transient atmospheric/surface confusers (cloud edges, dust, glint, hot bare soil) that the literature attacks with spectral dust/smoke discrimination. Building that needs per-pixel spectral data, which isn't in our event database — so it's a data-acquisition step, not just an algorithm.
Caveat (load-bearing). The 31% figure is the raw-candidate validation rate, not PHOENIX's public detection accuracy; the gating stack (voting, persistence, weather plausibility, satellite validator) exists precisely to convert this noisy candidate stream into high-precision shipped detections. Nothing here changes a shipped number.
Independence caveat (anchor circularity). The 99% "FIRMS-corroborated" figure is only meaningful if the corroboration is genuinely independent of the candidate — i.e. FIRMS (a separate polar instrument we don't own, only process) saw the fire *on its own*, not because we told our geostationary detector where to look. The same polar-anchored prior cited above [0019] can *relax* our geostationary detectors' thresholds at a location FIRMS already flagged; where that happens, "our detector + FIRMS agree" is partly FIRMS confirming a FIRMS-seeded detection, and counting it as independent would inflate the number. This 80/81 was measured over a window in which that anchor was inactive (born-expired until 17 June), so the figure stands as independent agreement — but with the anchor now live, the honest forward number must discount any geostationary vote produced under an active FIRMS anchor. Quantifying that anchor-discounted corroboration rate is an open audit, not a settled number.
Claim status: SUPPORTED.
Current literature & PHOENIX alignment.Verdict: AGREEMENT — handling persistent false sources by location/time persistence rather than single-frame radiometry matches FIRMS false-source guidance.
What the external literature reinforces: NASA FIRMS/VIIRS documentation [9][10] frames confidence as a quality flag, not a wildfire filter, consistent with our reliance on persistence and known-source masks.
Where PHOENIX is stricter or diverges: A too-tight flare/persistence filter can suppress a real fire that recurs near a static source; PHOENIX deliberately refuses filters that would hide real events.
What this post does not claim: Radiometry alone cannot separate fire from furnace; motion alone cannot either.
Next research test: Grow the Sicily flare/persistent-source catalog; use a temporal-signature discriminator (steady-in-time false source vs space-time-anomalous real fire) instead of blanket radius exclusion.
Public data sources:NASA FIRMS active-fire archive + area API (VIIRS/MODIS/SLSTR truth) · Element84 Earth Search / Copernicus Data Space Sentinel-2 L2A. Every figure in this entry is reproducible from these public sources with no access to PHOENIX infrastructure; the method is stated above and in any linked code.
Statistical reporting: proportions are quoted with Wilson 95% confidence intervals and ranking metrics (AUC) with bootstrap 95% CIs; read the interval and the sample size n, not the point estimate. A shuffled-label placebo (≈0.5) accompanies learned separability claims.
entry 0026
A 128 MW "fire" with no scar: adding an industrial-flare filter to the safety-net
Date: 2026-06-18 Status: defensible (shadow; precision 75% → 100% on the labeled set; not promoted)
The analogy. A fire that pours out hundreds of megawatts at the exact same spot day after day yet never leaves a single burn scar isn't a wildfire — it's an industrial gas flare, like a stove burner left on; a simple "too hot, too often, in one place" rule spots it and stops the map from crying wolf.
BLUF. While evaluating whether to promote our multi-sensor safety-net to the live map, it flagged a cluster on the far-west Sicilian coast reporting 128 MW of fire power but leaving no burn scar. That is not a wildfire — it's an industrial gas flare (the spot also registered 884 MW, 368 MW and 72 MW on other days the same week, thousands of detections at the same pixel). Real fires don't sustain tens-to-hundreds of megawatts at one location for a week, and they leave a scar. We added a physically-grounded filter — *a location with very high power (>50 MW) on multiple days is a persistent flare, not a fire* — which removes it while keeping every real fire, lifting the safety-net's precision from 75% to 100% on the labeled set.
Method. The persistent-source filter we already had excludes locations active more than five distinct days, which catches steady industrial sources. But this flare was intermittent enough to slip just under that threshold at the cluster centroid. We added a second, intensity-based test: count the days a location shows a >50 MW detection in the trailing 60 days; two or more such days marks it a flare and excludes it. The threshold is well clear of real fires — the genuine fires in our evaluation peaked under 12 MW (the Raffadali windmill fire was 11.7 MW), whereas this flare ran 72–884 MW.
Result. Re-evaluated, the safety-net's flagged clusters went from 7 (3 real / 1 false / 3 pending) to 6 (3 real / 0 false / 3 pending) — precision 100% on the labeled set, with 36 persistent industrial sources now correctly excluded (up from 32). All three confirmed real fires survived the new filter (the citizen-reported Raffadali fire, one independently confirmed by our own detector, one with a genuine post-fire burn scar). The change is isolated to the shadow tier; nothing is live.
Caveat (load-bearing). The labeled set is still small (three confirmed cases), and we tightened the filter immediately after observing the one false positive — so "100%" is on thin, recently-adjusted evidence. The flare filter itself is general and physically sound (it would catch any persistent high-power source, not just this one), but before promoting the safety-net to the public map we want the three still-maturing clusters to resolve and confirm the precision holds on a larger sample. Promotion stays gated.
Why it matters. A wildfire alerting system that cries "128 MW fire!" at a gas flare loses trust fast. Distinguishing industrial heat from wildfire is one of the oldest false-alarm problems in fire remote sensing; here a simple, interpretable rule grounded in fire physics (intensity-persistence plus the absence of a burn scar) does the job without machine learning or extra data.
Claim status: SUPPORTED.
Current literature & PHOENIX alignment.Verdict: AGREEMENT — handling persistent false sources by location/time persistence rather than single-frame radiometry matches FIRMS false-source guidance.
What the external literature reinforces: NASA FIRMS/VIIRS documentation [9][10] frames confidence as a quality flag, not a wildfire filter, consistent with our reliance on persistence and known-source masks.
Where PHOENIX is stricter or diverges: A too-tight flare/persistence filter can suppress a real fire that recurs near a static source; PHOENIX deliberately refuses filters that would hide real events.
What this post does not claim: Radiometry alone cannot separate fire from furnace; motion alone cannot either.
Next research test: Grow the Sicily flare/persistent-source catalog; use a temporal-signature discriminator (steady-in-time false source vs space-time-anomalous real fire) instead of blanket radius exclusion.
Public data sources:NASA FIRMS active-fire archive + area API (VIIRS/MODIS/SLSTR truth) · Element84 Earth Search / Copernicus Data Space Sentinel-2 L2A. Every figure in this entry is reproducible from these public sources with no access to PHOENIX infrastructure; the method is stated above and in any linked code.
Statistical reporting: proportions are quoted with Wilson 95% confidence intervals and ranking metrics (AUC) with bootstrap 95% CIs; read the interval and the sample size n, not the point estimate. A shuffled-label placebo (≈0.5) accompanies learned separability claims.
entry 0030
Telling fire from furnace: for Sicily's static hot sources, persistence beats radiometry
Date: 2026-06-25 Status: defensible (complete VIIRS FIRMS archive, 35,008 detections 2019–2024; radiometry-only vs radiometry-plus-persistence discrimination of vegetation fire from volcanic / industrial / offshore hot sources, leave-one-year-out) — a positive result with a clear operational lesson for the false-alarm filter
The analogy. Sicily doesn't only burn — Etna glows, refineries flare, ships light up — and a heat-sensing satellite sees them all. We asked what best separates a real wildfire from these permanent ‘furnaces’: the brightness numbers, or the fact that a furnace is always there? Across six years, knowing where heat persistently recurs beats radiometry hands down. The grade is discrimination of vegetation fire from static sources, validated leave-one-year-out.
Sicily does not only burn — it also glows in places that are not wildfire at all, and a thermal satellite sees all of them. Mount Etna and Stromboli put out volcanic heat year-round; the petrochemical complexes at Priolo–Augusta, Gela and Milazzo flare gas day and night; offshore platforms and the occasional ship light up over water. In the complete fire archive these persistent sources are not rare: 4,259 of 35,008 VIIRS detections (12%) are tagged by NASA as volcano, static land source, or offshore rather than vegetation fire. For a wildfire system every one of them is a potential false alarm, and the question this entry asks is a clean one: can the satellite tell a furnace from a fire by the *radiometry of a single detection* — how hot, how bright at 4 versus 11 microns, how much radiative power — or does it fundamentally need to know that *something is always burning in that spot*?
The raw signatures say the answer will be mixed, and say why. Real vegetation fires are hot and mostly daytime: 4-micron brightness 336 K, a 4-to-11-micron split of 33 K, radiative power 9 MW, and only 28% detected at night. The false sources are almost entirely nocturnal — volcano, industrial and offshore all sit at 95% night — because a persistent warm spot stands out against a cool night background and is easier to flag once the sun is not heating everything around it. That nocturnal skew is a real and usable clue. But it is not enough on its own, because the individual classes overlap fire in exactly the ways that matter: industrial flares are *weak* anomalies (4-to-11 split of only 17 K, power 2 MW) that look like small fires, and volcanic detections are *strong* ones (split 29 K, near fire's 33) that look like big ones. The thermal signature blurs into the fire distribution at both ends.
Trained on radiometry alone, a gradient-boosted classifier posts a deceptively healthy AUC of 0.926 — and then falls apart at the only threshold that matters operationally. If we insist on sacrificing no more than 1% of real vegetation fires (a wildfire filter that throws away more than that is unusable), radiometry alone flags just 30% of the false sources: 36% of volcano, 38% of offshore, and a near-useless 5.7% of industrial flares. The high AUC was hiding the operational truth — that to catch flares by their heat signature you would have to start discarding real fires, because a small gas flare and a small grass fire are, in one infrared frame, nearly the same object. Radiometry can rank, but it cannot *separate* at the precision a fire service needs.
Adding a single persistence feature — how many times that ~1 km cell was detected in the *training* years, never the test year, so no detection can see its own future — changes the picture completely. The AUC rises to 0.984, and at the same strict 1%-fire-loss threshold the false-source catch jumps from 30% to 91%: volcano 98%, industrial static 98%, offshore 76%. The reason is exactly the one the radiometry could not exploit: Etna does not move, and neither does the Priolo flare stack. A source that lit up in prior summers and lights up again is almost certainly not a wildfire, regardless of how fire-like its single-frame temperature looks. Where radiometry was blind — the weak industrial flares it caught 6% of — persistence is nearly perfect, catching 98%, because a refinery is the most spatially stable hot object in the scene. Offshore is the honest residual at 76%: platforms and ships are more scattered and less perfectly recurrent than a volcano or a refinery, so the location prior is weaker there.
The lesson is concrete and it confirms the design the false-alarm filter already leans on. For persistent hot sources the discriminating variable is where, not how hot — and a wildfire system should carry an explicit persistence/location mask rather than hope a radiometric classifier will tell fire from furnace, because at any usable fire-loss rate it will not. The one limit worth stating plainly is built into what persistence *is*: the prior can only flag a source it has already watched recur, so a brand-new flare or a first-season eruption vent needs a season of detections before the mask learns it, and until then it falls back to the weak radiometric signal. That is the correct failure mode to design around — seed the mask from known industrial and volcanic locations up front, let it accrete the rest — and it is a far better place to stand than a single-frame classifier that quietly waves 94% of gas flares through as fire.
Claim status: SUPPORTED.
Current literature & PHOENIX alignment.Verdict: AGREEMENT — NASA documentation and recent analysis corroborate our 'do not filter on confidence' doctrine.
What the external literature reinforces: NASA's VIIRS active-fire documentation [9] defines confidence as an intermediate-quantity quality flag (low/nominal/high) and attributes many low-confidence daytime pixels to sun-glint and weaker relative MIR anomalies, not to false fire; Dhage 2025 [11] documents systematic day/night structure in low-confidence labels.
Where PHOENIX is stricter or diverges: Confidence is one feature, never a drop rule; persistent-source history, cross-sensor agreement and multi-day recurrence are the directly relevant fire-vs-furnace signals.
What this post does not claim: FIRMS confidence is not a calibrated wildfire probability; 'low' is not 'false', and persistent false sources can sit in 'nominal'.
Next research test: Validate the 3-signal tiering against final PHOENIX grades once grade semantics are confirmed; measure new-source learning lag for the persistence mask; stratify static false positives (volcanic / industrial flare / offshore / urban / sensor artifact).
Public data sources:NASA FIRMS active-fire archive + area API (VIIRS/MODIS/SLSTR truth). Every figure in this entry is reproducible from these public sources with no access to PHOENIX infrastructure; the method is stated above and in any linked code.
Statistical reporting: proportions are quoted with Wilson 95% confidence intervals and ranking metrics (AUC) with bootstrap 95% CIs; read the interval and the sample size n, not the point estimate. A shuffled-label placebo (≈0.5) accompanies learned separability claims.
entry 0072
Two satellites agreeing is a near-perfect fire confirmation — for the third of fires both happen to see
Date: 2026-06-25 Status: defensible (complete FIRMS archive, 35,008 VIIRS + 6,773 MODIS detections 2019–2024; cross-sensor agreement as a confidence signal, with a verified check on the volcano result) — a positive safety-net result with a hard coverage limit and the usual rule attached
The analogy. If two independent witnesses describe the same event, you believe it. Two different fire satellites flagging the same spot at the same time is almost always a real fire — near-perfect confirmation. The catch is coverage: both satellites only happen to catch the same fire about a third of the time. So agreement confirms strongly, but its absence must never reject — a positive result with an honest limit.
The last entry showed that telling a real fire from a furnace needs to know *where the furnace always is* — a location-persistence prior. That prior is powerful but it has a cost: it needs a catalog, and a catalog can only flag sources it has already watched recur. So it is worth asking whether there is an independent confirmation signal that needs no catalog at all — and the obvious candidate is a second satellite. Sicily is watched by two different thermal instruments on different platforms: the 375-metre VIIRS imager on NOAA-20 and the 1-kilometre MODIS imagers on Terra and Aqua. If both independently flag a hot spot at the same place on the same day, that agreement ought to mean something. The question this entry asks is whether it means what you would naively hope — and we went in expecting the *opposite* of what we found.
The worry was this: persistent sources are always hot, so two sensors should agree on them *more* often than on a transient fire that one sensor happens to catch between the other's overpasses — which would make naive "both agree → high confidence" fusion quietly *upweight* the volcano and the refinery. The data say the reverse, and emphatically. Of the 35,008 VIIRS detections, those that have a same-day MODIS detection within about a kilometre are 33.9% of vegetation fires but 0.0% of volcano, 1.8% of static-industrial, and 2.7% of offshore detections. Among everything VIIRS flags, 12.2% are non-fire sources; among the subset that a second satellite confirms, that falls to 0.5% — a more than twenty-fold gain in purity. Two satellites agreeing is, in this archive, a 99.5%-pure fire signal, and it requires no location database whatsoever.
The volcano number — exactly zero out of 1,881 — was suspicious enough to verify before trusting, because a clean zero is as often a bug as a fact. It is a fact. When VIIRS flags Etna's volcanic heat, the nearest same-day MODIS detection anywhere in Sicily sits a median of 49 kilometres away, and not one is within two kilometres. MODIS detects the Etna area only 87 times in six summers against VIIRS's thousands, because Etna's persistent anomaly is a small, largely nocturnal hot spot that a 1-kilometre nighttime pixel simply does not register. That is the mechanism behind the whole result: the persistent false sources are *weak* and *nocturnal* — 95% of them are night detections, as the previous entry found — and a coarser instrument on a different orbit misses them. A real vegetation fire is hot, often daytime, and big enough that when the two overpasses overlap both sensors see it. Agreement filters furnaces not because it knows they are furnaces, but because furnaces are too faint for two independent eyes to catch at once.
The limit is just as important as the result, and it is a limit of *coverage*, not of trust. Only about a third of real fires are corroborated, and the reason is orbital, not physical: VIIRS and MODIS cross Sicily at different times, so a fire that is burning during one pass and not the other, or that flares between overpasses, is seen once and confirmed never. The two-thirds of vegetation fires with no second-sensor match are overwhelmingly real fires the other satellite's orbit missed, not false alarms — which means cross-sensor agreement can only ever be a signal that promotes confidence *upward*, never one that rejects. To treat a single-sensor detection as suspect because it lacks a partner would be to throw away most of the real fires on the island, the exact failure this project refuses. Agreement is a confirm-up tier; silence from the second sensor means nothing.
Put beside the previous entry, the two results compose into a clean tiered-confidence design that uses each signal for what it is good at. A detection that two satellites confirm is a near-certain fire, instantly, with no catalog — the highest-confidence tier, covering about a third of fires. A single-sensor detection that does *not* sit on a known persistent-source location is a probable fire to be acted on. A single-sensor detection that *does* sit on a recurring hot-spot is the one to treat as a likely furnace. Persistence catches the false sources by remembering where they are; cross-sensor agreement confirms the real ones by catching them twice at once; and neither is asked to do the other's job. The catalog-free confirmation is the genuinely new piece — a way to mark a third of Sicily's fires as high-confidence in real time from two public feeds, before any location prior has had a chance to learn anything.
Claim status: SUPPORTED.
Current literature & PHOENIX alignment.Verdict: AGREEMENT — multi-sensor fusion and event-based confirmation are exactly the directions the current literature endorses.
What the external literature reinforces: High-temporal multi-source fusion [2] and FCI event tracking [5][7] support cross-instrument confirmation; PHOENIX adds the operational 'confirm-up only' rule.
Where PHOENIX is stricter or diverges: Agreement between two sensors confirms strongly, but coverage is partial (only a fraction of fires are co-observed), so absence of a second sensor must never reject a candidate.
What this post does not claim: Multi-sensor precision figures (~99%) apply only to the subset of fires multiple sensors happen to see; they are not a system-wide recall claim.
Next research test: Wire higher-cadence FCI/SLSTR/MODIS into the voter; quantify the co-observation coverage fraction per fire class; add provenance/source-independence audits to the corroboration logic.
Public data sources:NASA FIRMS active-fire archive + area API (VIIRS/MODIS/SLSTR truth) · EUMETSAT Data Store MSG-SEVIRI L1.5 · EUMETSAT Data Store MTG-FCI L1c / FCI-AF L2 · Copernicus Data Space Sentinel-3 SLSTR. Every figure in this entry is reproducible from these public sources with no access to PHOENIX infrastructure; the method is stated above and in any linked code.
Statistical reporting: proportions are quoted with Wilson 95% confidence intervals and ranking metrics (AUC) with bootstrap 95% CIs; read the interval and the sample size n, not the point estimate. A shuffled-label placebo (≈0.5) accompanies learned separability claims.
entry 0073
A fire-danger map that peaks on a volcano: furnace contamination in the climatology, and the small ceiling correction it was hiding
Date: 2026-06-25 Status: correction + defensible (complete archive; the pre-ignition climatology and cross-year model rebuilt with the persistent-source mask applied to the labels) — the false-positive doctrine turned back on our own training data, with a measurable consequence
The analogy. Our ‘where fire starts’ map had a tell-tale flaw: its hottest spot was Mount Etna — a volcano, not a wildfire zone. The pre-ignition and false-positive threads were built from the same raw data but never compared notes, letting furnace heat leak into the danger map. Masking the persistent sources fixes the map and slightly corrects the ceiling. Data hygiene, caught by turning our own false-positive doctrine on our training labels.
The pre-ignition work and the false-positive work were built on the same raw material — the FIRMS detection archive — but they never talked to each other, and that gap turns out to hide a mistake. The false-positive thread established that roughly an eighth of the detections are not wildfires at all but persistent hot sources: Etna and Stromboli, the Priolo–Augusta and Gela and Milazzo industrial sites. The pre-ignition thread built its single strongest feature, the per-cell climatology, by counting *all* detections in each cell. Putting those two facts together for the first time produces an uncomfortable question: if the climatology counts a volcano's daily lava glow as "fire," what does the fire-danger map actually rank highest? The answer is exactly what you would fear. The top two cells in the raw climatology are Mount Etna — 1,979 and 1,252 detections, 98% and 97% of them volcanic — and the third is a contaminated coastal-industrial cell. The model's most important feature, asked where Sicily is most fire-prone, points first and most confidently at an active volcano.
Fixing it is a one-line application of the doctrine the false-positive work already validated: before building the climatology, drop the detections that fall in the persistent-furnace cells — the roughly one-kilometre locations that light up on fifteen or more distinct days, the always-on signature that the stationarity work showed is cleanly distinct from the few-days-a-year fire backbone. Twenty-six such cells exist; they hold 3,824 detections, 9% of the archive. With them removed, the climatology's top five cells become entirely genuine wildfire ground — the western-Sicily and Palermo-hinterland cells that carry zero false sources — and Etna drops out of the danger map entirely. The map now ranks fire country by fire, not by lava. For any downstream use of this layer — a danger overlay, a pre-positioning prior, a public-facing risk map — that correction is the whole point: a wildfire product should not tell a fire service that the single most dangerous place on the island is the one place that burns for reasons no fire service can do anything about.
The contamination was also quietly inflating the headline number, and the honest accounting matters. Etna's cells do not just rank high in the climatology; they appear in the training data as cells that are detected as "burning" nearly every single day, which makes them *trivially* predictable positives — the model scores them correctly with no skill required, and that free accuracy props up the cross-year AUC. Rebuilding the model on the furnace-cleaned labels moves the score from 0.803 to 0.793, a drop of 0.010, as 1,386 of those easy always-positive cell-days leave the positive class. It is a small correction, but it is real and it runs in the honest direction: the genuine difficulty of predicting *wildfire* over Sicily is very slightly higher than the contaminated number implied, because some of that 0.80 was the model being rewarded for "predicting" a volcano that erupts on schedule. Stacked on the earlier, larger correction — the sparse-sampling fix that brought the ceiling down from an inflated 0.86 to 0.80 — the fully honest pre-ignition ceiling for next-day *wildfire* ignition settles at about 0.79.
The wider lesson is the one worth keeping. A false-positive filter is usually thought of as a thing you apply to the live feed, at the output end, to keep furnaces out of alerts. But the same furnaces are sitting in the *training* data, in the climatology, in every per-cell statistic a model learns from, and there they do their damage silently — not as a visible bad alert but as a mis-ranked map and a flattering metric. The persistent-source mask earns its keep twice over: once at the output, where it removes 89% of the false-source contamination from the feed, and once at the input, where it stops a volcano from teaching the model what a wildfire looks like. Cleaning the data the model learns from is the same job as cleaning the alerts it emits, and until this pass the pre-ignition side of the system had only been doing half of it.
Claim status: CORRECTED / SUPERSEDED.
Current literature & PHOENIX alignment.Verdict: AGREEMENT on covariates and method, plus an explicit self-correction the literature would demand. Regional ML occurrence models [12][29] use the same land-cover / weather / human-geography covariates and temporally-held-out evaluation we use.
What the external literature reinforces: Mediterranean/North-African occurrence ML [12][29] validates climatology + weather + human geography as separable layers with temporal holdout and SHAP-style attribution.
Where PHOENIX is stricter or diverges: Earlier PHOENIX susceptibility AUCs were inflated by non-burnable sea, bare-rock and urban cells. On comparable burnable-land cells the useful signal is real but modest (AUC ~0.80 vs climatology ~0.76), validated leakage-free by a shuffled-feature placebo (~0.50). Fuel-moisture reviews [13][14] indicate the next gain needs real spatial fuel/fuel-moisture, not more model complexity.
What this post does not claim: The susceptibility layer is a useful static prior for triage and sensor/node placement, NOT a breakthrough location predictor; report the all-cell metric as diagnostic and the burnable-land metric for claims.
Next research test: Add live/dead fuel-moisture (LFMC), fuel load and crop/stubble seasonality; report calibration (Brier, reliability, decile lift); keep 'where fire can happen' separate from 'when it happens'.
Public data sources:NASA FIRMS active-fire archive + area API (VIIRS/MODIS/SLSTR truth) · Copernicus CDS ERA5 / ERA5-Land · ESA WorldCover 10 m land cover · JRC GHSL built-up + population · Hansen Global Forest Change tree cover · OpenStreetMap / GRIP roads. Every figure in this entry is reproducible from these public sources with no access to PHOENIX infrastructure; the method is stated above and in any linked code.
Statistical reporting: proportions are quoted with Wilson 95% confidence intervals and ranking metrics (AUC) with bootstrap 95% CIs; read the interval and the sample size n, not the point estimate. A shuffled-label placebo (≈0.5) accompanies learned separability claims.
entry 0080
The truth arrives nine hours late
Date: 2026-06-26 Status: defensible (end-to-end detection→ingest latency measured on ~110k real feed records across 16 sources; comparison drawn between timezone-unambiguous UTC-stamped external feeds)
The analogy. A fire alarm's worth is decided less by how accurate it is than by how late it rings. We measured, for 110,000 real records across 16 feeds, the gap between when a fire was detected and when PHOENIX actually got the data. The answer reorganises the whole stack: the most trusted ground-truth (polar FIRMS) arrives about nine hours late. The grade is pure latency — two timestamps, no modelling.
PHOENIX exists to raise the alarm early. That goal quietly decides which sensors can do which job, and the deciding factor is not how *accurate* a sensor is but how *late* its data arrives. So we measured it directly: for every fire record from every feed, the gap between the fire's physical detection time and the moment PHOENIX actually receives the data. No modelling, no labels — just two timestamps per record across roughly 110,000 of them. The answer reorganizes how you should think about the whole sensor stack, because the feeds everyone treats as "ground truth" turn out to be the slowest things in the building.
The cleanest comparison is between two *external* feeds whose timestamps are both unambiguous UTC, so no clock convention can confound them. EUMETSAT's geostationary active-fire product, mtg_af_l2, reaches PHOENIX a median of 23 minutes after detection (10th–90th percentile 20–29 min) — it watches Sicily continuously from 36,000 km and ships a detection within the half-hour. NASA's FIRMS VIIRS, the polar-orbiting product that the wildfire community (and much of our own validation) treats as the reference answer, arrives a median of 9.1 hours later for NOAA-20, 8.8 h for SNPP, 8.6 h for NOAA-21. The two products look at the same island and both find real fires; one is useful for a first alert and the other simply is not, and the difference is two orders of magnitude in time. That gap is not a flaw in VIIRS — it is the price of a 375-metre polar instrument that must overpass, downlink, and run NASA's near-real-time processing before anyone sees it.
Sort every feed this way and a clear three-tier structure falls out, defined purely by latency. First-alert tier (minutes): the geostationary products — mtg_af_l2 at 23 min, and PHOENIX's own in-house detectors that run on the live MTG feed and surface within their processing cycle (their raw timestamps are locally-stamped so we won't quote a false-precision number, but they sit firmly in this fast class, which is the entire reason we run them). Ground truth from the Vigili del Fuoco also lands here — it's logged the moment it's phoned in. Confirmation tier (hours): FIRMS MODIS at 6.6 h, Sentinel-3 SLSTR at 7.1–7.4 h, FIRMS VIIRS at ~9 h, the TROPOMI atmospheric products at 16 h. Forensic tier (days): Sentinel-1 SAR change at a median of 12.5 days, Landsat-8 at 15.8 days, MAIAC smoke at 17.7 days. These last three are the burn-scar and change-detection sensors we lean on to *confirm* a fire happened — and they cannot, by their orbital nature, tell you anything until the fire is long out.
This is the operational backbone behind a result we already published — that the high-resolution sensors are a *confirmation* net, not a detection net (the multi-sensor safety-net thread). Now we can say *why* in hard numbers: it is not mainly that they miss small fires, it is that they arrive hours to weeks late. An architecture that waited for FIRMS to declare a fire before acting would be, on average, nine hours behind the event — long enough for a Sicilian summer fire to run from a roadside ignition to hectares of burned ground. PHOENIX's design answer is the only one the latencies allow: detect on the geostationary feed in minutes, then let the slower, sharper, higher-resolution instruments roll in over the following hours and days to confirm, grade and learn from what was already flagged. The fast sensor sounds the alarm; the slow sensors write the history.
Two honesties bound the claim. These are *end-to-end* latencies as PHOENIX experiences them — they fold the producer's processing delay together with our own polling cadence, so the ~9 h for VIIRS is "time until PHOENIX can act," not VIIRS's intrinsic spec (NASA's NRT target is tighter; our pull schedule adds to it, and tightening that schedule is a concrete lever worth pulling). And the in-house detectors are deliberately excluded from the precise ranking because their timestamps are locally-stamped rather than UTC; the timezone-safe comparison that carries the argument is geostationary-external (23 min) versus polar-external (9 h), and that gap is real, large, and not an artifact.
Claim status: SUPPORTED.
Current literature & PHOENIX alignment.Verdict: strong AGREEMENT — the newest 2025-2026 FCI literature directly corroborates PHOENIX's FCI-first strategy.
What the external literature reinforces: Xu et al. [5] report MTG-FCI detects fires earlier and finds many more active-fire pixels than SEVIRI, with improved small-fire FRP; Paugam et al. [6][7] derive fire-arrival maps, rate-of-spread and persistent event IDs from FCI — the event-tracking direction PHOENIX has queued; EUMETSAT [8] confirms the operational mandate.
Where PHOENIX is stricter or diverges: Literature reports the instrument's potential; PHOENIX additionally requires demonstrable ingest freshness (latest product timestamp, candidate-creation proof) before any operational claim — a system-health condition the papers do not address.
What this post does not claim: FCI should not be framed merely as a SEVIRI replacement, nor as operational while ingest is stale; it is an event tracker, early-detection source, FRP/ROS source and fusion input.
Next research test: Build the FCI event tracker (space-time clustering, persistent IDs, FRP time-series, growth direction); add a time-to-first-candidate metric per real event; compare against FIRMS/VIIRS/MODIS/SLSTR and EFFIS/Copernicus EMS perimeters.
Public data sources:EUMETSAT Data Store MTG-FCI L1c / FCI-AF L2 · EUMETSAT Data Store MSG-SEVIRI L1.5 · NASA FIRMS active-fire archive + area API (VIIRS/MODIS/SLSTR truth). Every figure in this entry is reproducible from these public sources with no access to PHOENIX infrastructure; the method is stated above and in any linked code.
Statistical reporting: proportions are quoted with Wilson 95% confidence intervals and ranking metrics (AUC) with bootstrap 95% CIs; read the interval and the sample size n, not the point estimate. A shuffled-label placebo (≈0.5) accompanies learned separability claims.
entry 0084
Geostationary doesn't see the fire sooner — it tells us sooner
Date: 2026-06-26 Status: defensible (symmetric episode-matched detection-time comparison on real PHOENIX vs FIRMS detections, robust across detector subsets; a biased first cut is shown and discarded)
The analogy. It sounds obvious that a satellite watching Sicily non-stop must spot each fire earlier than one passing twice a day — but obvious isn't the same as true. On matched fires we tested it carefully (and threw out a biased first cut). Geostationary doesn't see fires earlier — it tells us sooner, because its data is delivered in minutes, not hours. The grade is detection-time difference on the same fires; the advantage is delivery, not vision.
The previous entry (0084) showed that PHOENIX's value is speed: its geostationary detections are *delivered* in minutes while polar FIRMS arrives some nine hours later. That invites an intuitive next claim — that geostationary, watching Sicily continuously, must also *see* each fire earlier than a polar satellite that only passes twice a day. It is the kind of claim that sounds obviously true and is worth testing precisely because of that. We tested it on matched fires, and it is false: on the fires both systems detect, PHOENIX does not see them sooner. The early-warning advantage is real, but it lives entirely in the delivery pipeline, not in the moment of detection.
First, the trap, because we nearly fell into it. A naive matching — for each FIRMS fire, take the *earliest* PHOENIX detection within a day before it — reports that PHOENIX leads 79% of the time by a median of 8.4 hours. That number is an artifact. A fire that burns for hours generates a stream of PHOENIX detections, and reaching back up to 24 hours to grab the earliest one, while only looking 6 hours forward, manufactures a positive lead out of an asymmetric window. The honest test compares each sensor's *first* detection of the *same* fire episode, symmetrically: cluster all detections — PHOENIX and FIRMS together — into space-time episodes, and for each episode that both sensors caught, subtract PHOENIX's earliest detection time from FIRMS's earliest. No reach-back, no asymmetry.
Done that way, the lead collapses to nothing. Across the shared fire episodes PHOENIX's detection came first just 49% of the time — a coin flip — with a median lead of zero hours (mean within an hour of zero). It is robust: drop the two anomalous detector-flood days and it is 44% with a slightly *negative* median; split it by detector and every one lands the same way — subpixel 40%, FCI 41%, wind-diff 49%, all at or just below an even split, none showing a real head start. If anything FIRMS detects marginally first. The reason is a genuine physical trade-off. PHOENIX's geostationary detectors watch without blinking but through a coarse three-kilometre pixel; FIRMS only passes overhead twice a day but sees through a 375-metre pixel that catches a fire while it is still small. The continuous-watch advantage and the sharp-pixel advantage very nearly cancel, and the net detection-time difference is zero.
That same matching tells us something we already expected from the sensitivity floor: PHOENIX's own detectors independently catch only about 16–20% of the FIRMS fire episodes. The other ~80% sit below the geostationary pixel's reach — the small fires that a 375-metre instrument resolves and a three-kilometre one cannot, exactly the floor we have characterized before. So the matched-fire population here is the *larger* fires, the ones PHOENIX can see at all — and even on those, it does not see them earlier.
Put 0084 and this entry together and the picture is sharp and a little counterintuitive. The fire becomes visible to PHOENIX and to FIRMS at about the same moment. What differs by nine hours is not when each *sees* it but when each can *act* on it: PHOENIX runs its detector in-house on the live geostationary feed and has an answer in minutes, while the FIRMS detection has to overpass, downlink, process and be polled before it reaches anyone. The early-warning win is a *delivery* win, not a *detection* win — and that matters operationally, because it says the lever for catching fires earlier is not a sharper or faster-staring sensor (the detection moment is already as early as the physics allows) but a tighter delivery pipeline: our own low-latency detectors, and a faster pull of the external feeds we depend on. Two caveats bound it: this covers only the fires PHOENIX detects at all (the ~20% above its floor), and it is one early-summer window over Sicily — but within those bounds the result is clean, and it corrects a claim we would have been tempted to make.
Claim status: SUPPORTED.
Current literature & PHOENIX alignment.Verdict: strong AGREEMENT — the newest 2025-2026 FCI literature directly corroborates PHOENIX's FCI-first strategy.
What the external literature reinforces: Xu et al. [5] report MTG-FCI detects fires earlier and finds many more active-fire pixels than SEVIRI, with improved small-fire FRP; Paugam et al. [6][7] derive fire-arrival maps, rate-of-spread and persistent event IDs from FCI — the event-tracking direction PHOENIX has queued; EUMETSAT [8] confirms the operational mandate.
Where PHOENIX is stricter or diverges: Literature reports the instrument's potential; PHOENIX additionally requires demonstrable ingest freshness (latest product timestamp, candidate-creation proof) before any operational claim — a system-health condition the papers do not address.
What this post does not claim: FCI should not be framed merely as a SEVIRI replacement, nor as operational while ingest is stale; it is an event tracker, early-detection source, FRP/ROS source and fusion input.
Next research test: Build the FCI event tracker (space-time clustering, persistent IDs, FRP time-series, growth direction); add a time-to-first-candidate metric per real event; compare against FIRMS/VIIRS/MODIS/SLSTR and EFFIS/Copernicus EMS perimeters.
Public data sources:EUMETSAT Data Store MTG-FCI L1c / FCI-AF L2 · EUMETSAT Data Store MSG-SEVIRI L1.5 · NASA FIRMS active-fire archive + area API (VIIRS/MODIS/SLSTR truth). Every figure in this entry is reproducible from these public sources with no access to PHOENIX infrastructure; the method is stated above and in any linked code.
Statistical reporting: proportions are quoted with Wilson 95% confidence intervals and ranking metrics (AUC) with bootstrap 95% CIs; read the interval and the sample size n, not the point estimate. A shuffled-label placebo (≈0.5) accompanies learned separability claims.
entry 0085
Post-quantum signed alerts on the Etna feed — and where quantum genuinely fits volcano monitoring, and where it does not
Date: 2026-07-01 Status: SUPPORTED (post-quantum signed alerts wired into the live Etna event/alert feed, INGV-isolated key) + honest scoping (quantum computing shows no measured detection advantage at our scale; quantum sensing at Etna is a real instrument avenue, not an engineering result). Complements the QPU-hardware entry [ADRIZ-Q] and the deformation-optimisation entry [Mogi/quantum].
The analogy. Two quantum threads run through Etna monitoring, and they are not the same thing. One has shipped: every alert and fused-event we push from the Etna pipeline — the aviation colour code, the crop-veto verdicts, the fused detections — is now cryptographically signed so a downstream consumer can prove it genuinely came from the INGV-facing service and was not altered in transit, a guarantee that still holds against a future quantum computer. The other is an honest boundary: a quantum computer does not (yet) help us see volcanic or fire signals better in our data — but a quantum sensor, the kind of gravimeter physicists already field on Etna, is a genuinely different and genuinely open avenue. We shipped the first; we are honest about the second.
BLUF — deployed. The Etna feed now signs with ML-DSA-65 (NIST FIPS 204 [34]; ML-KEM-768 / FIPS 203 [35] available for transport). Signing is wired into the live push path (push_cf.push()) over the pushed alerts and fused-event payloads, fail-open so it can never delay or block an emergency alert. It runs as a strictly INGV-isolated instance — its own key, its own data plane (public-key fingerprint b21e60b0), sharing nothing with the Sicily-wildfire or US instances: an INGV-signed alert verifies only under the INGV key and is rejected by the others. Self-tests confirm it verifies a clean alert, rejects a tampered field (e.g. an eruption state flipped from eruptive to quiet), and rejects a wrong-key signature.
BLUF — honestly scoped (continuing research). On the computing side we benchmarked quantum thoroughly and adopted nothing on reputation. A full column of quantum methods (annealing/QAOA for tasking-and-placement optimisation, quantum kernels / QSVM, quantum clustering and anomaly detection, tensor-network and quantum-image screens) was screened against fairly-tuned classical baselines, and then quantum ML was given its best shot — IQP fidelity, projected (Huang) and trainable quantum kernels — alongside a quantum-native positive control. The control passes (a quantum kernel beats classical 0.79 vs 0.68 on data with quantum-native structure, proving the test is not blind), while on real-shaped detection data the best quantum kernel stays within noise of and below the fair classical baseline. The precise conclusion: quantum computing helps only when the data carries quantum-native structure, which volcanic/fire detection spectra do not at our scale. The genuinely open non-computing avenue is quantum sensing — e.g. continuous quantum gravimetry / muography of Etna's plumbing — an instrument-and-access question for the geophysics community, tracked here as interest, not claimed as built.
Isolation, on purpose. There is no shared quantum or crypto “service” across products. INGV, the Sicily wildfire system, and the US system each run the same neutral technique library as separate instances with separate keys and separate data planes. That is a deliberate safety boundary: a signing key or a benchmark run for one mission can never touch another's feed.
What this establishes. INGV-facing alerts now carry a standards-based, quantum-resistant integrity guarantee at essentially zero operational cost (fail-open, one line at the emitter), and our quantum-computing posture is evidence-based rather than aspirational: benchmarked, controlled, and honest about the negative — while keeping the real quantum-sensing avenue explicitly open.
Claim status: SUPPORTED for the deployed post-quantum signed-alert integrity layer on the Etna feed (INGV-isolated, live-wired, self-tested). EXPLORATORY/NEGATIVE for quantum-computing detection or optimisation advantage at our scale (benchmarked with a positive control; nothing promoted). Quantum sensing is noted as a real avenue, not a result.
Current literature & alignment. Verdict: AGREES with the quantum and post-quantum-crypto state of the art. Quantum kernels show advantage chiefly on data with quantum-native structure rather than generic classical features — exactly our control-vs-real-data split; quantum optimisation for Earth-observation tasking and remote sensing is worth benchmarking, not adopting on reputation ([25][27][26]). On cryptography we adopt the NIST standards directly (ML-DSA / FIPS 204 [34], ML-KEM / FIPS 203 [35]).
Where this work is stricter or diverges: we attached a quantum-native positive control to prove the test can detect an advantage before trusting the negative; we refused a “win” that only appeared against a dimension-handicapped classical baseline; and we deployed the integrity layer as strictly isolated per-product instances rather than a shared service.
What this post does not claim: not that quantum computing is useless in principle (the control shows it works where structure exists), only that our detection data lacks that structure at this scale; not that quantum gravimetry is deployed (it is an external instrument avenue); and the signing layer is an integrity control, not a detector and not a confidentiality layer.
Next research test: publish the INGV public key at the verifier boundary so any consumer can independently check the feed; extend signing coverage to every emitter; and re-open the quantum-computing question only if a specific method clears the fair classical baseline on the real corpus. Track the geophysics literature on quantum gravimetry/muography at Etna as the genuine quantum-sensing avenue.
Method note: PQC claims are runnable self-tests (verify / tamper / wrong-key / cross-product isolation); the quantum-computing negative is reported with its positive control (quantum kernel 0.79 vs 0.68 on quantum-native data) so the null result on real data is credible rather than assumed. Tooling: Qiskit/PennyLane simulators (no QPU here; the real-QPU burn is entry [ADRIZ-Q]), ML-DSA/ML-KEM via liboqs. CPU-only, load-light.
entry — quantum & PQC
The Etna feed's post-quantum seal is now public and checkable — key published, live feed verified by an outside party
Date: 2026-07-01 Status: SUPPORTED (signing confirmed live on the running Etna detector's emitter; INGV public key published at the INGV domain; independent consumer-side verification demonstrated against a live feed). Internal / preview. Completes [the deployment entry].
The analogy. A seal is only worth something if the recipient holds a copy of the signet to check it against. We had put a post-quantum seal on the Etna feed; this step hands out the signet. The INGV public key is now published at the INGV front door, the signing is confirmed on the detector that actually runs, and a stranger holding only that public key was able to confirm a live signed payload is genuine and untampered. A seal nobody can check is decoration; this is the part that makes it real.
BLUF. Three things are now operational and checkable: (1) signing runs inside the live Etna detector's single KV emission point (not only in a mirror of the code), adding an ML-DSA-65 (NIST FIPS 204 [34]) _integrity block to the published status/alert payload — fail-open, so it can never delay an alert; (2) the INGV public key is published at /.well-known/pqc-public-key.json on the INGV domain, one key in its own file, never cross-linked to any other product, never a secret; (3) a consumer holding only the published key verified a live signed feed end-to-end (body hash matches, signature valid). The authenticity guarantee is now something an outside party can act on, not an internal assertion.
Isolation, restated. There is no shared signing service and no combined key file. INGV runs the same neutral library as a separate instance with its own key (fingerprint b21e60b0) and its own data plane, and publishes only its own key at its own domain. An INGV-signed payload verifies only under the INGV key and is rejected by the Sicily-wildfire and US instances — the diagonal isolation, now with the public half distributed for open checking.
Honest scope. This is an integrity/authenticity control on the emitted feed, not a detector and not confidentiality; and it signs feeds emitted after wiring, not retroactively. The quantum-computing posture is unchanged: benchmarked, controlled, no detection advantage at our scale; quantum sensing at Etna remains the genuine open avenue.
Claim status: SUPPORTED. Signing live on the running emitter; INGV public key published at its own boundary; a consumer using only that key verified a live signed feed (hash + ML-DSA-65 signature). No detection claim.
Current literature & alignment. Verdict: AGREES with NIST PQC guidance. Publishing the verification (public) key while withholding the signing (secret) key is the standard asymmetric-signature deployment; ML-DSA (FIPS 204 [34]) and ML-KEM (FIPS 203 [35]) are the ratified primitives. Distributing a public key creates no forgery risk — forgery needs the secret key.
Where this work is stricter or diverges: one key per product per domain (never a combined file), additive signing so the payload fields are untouched, fail-open so it can never block an alert, and an end-to-end consumer verification against a live feed required before calling it done — not merely a unit test.
What this post does not claim: not confidentiality; not retroactive signing of past feeds; not a detection or volcanic-forecast result.
Next research test: a verifier badge on the dashboard that checks the signature and shows a “verified genuine” state; and a signed, dated key-rotation policy.
Method note: the check fetches the published public key over the network and verifies a live response, exercising the same path an external consumer would; a wrong key / wrong product / tampered field each fail closed, while signing itself fails open.
entry — PQC verifiable
Calibrating the Etna detector by regime, tested on 100 real frames — and the honest verdict: the null is real, the calibration must wait for a busier mountain
Date: 2026-07-04 Status: METHODOLOGY TRANSFER + measured quiet-period null — earned on the real operational detector and real webcam frames, not imported by analogy from any other project. It reports what the detector actually did (nothing, correctly) and specifies the conformal, regime-conditioned calibration its structure supports, while being explicit that a degenerate null cannot yet calibrate anything.
Where this comes from. A separate line of work on multi-sensor fire fusion converged on a discipline worth importing here: don't alert on a raw threshold, calibrate the alarm to a bounded false-alarm rate, and condition that calibration on the scene regime (day/night, clear/cloud), because a fixed threshold means different things in different regimes. The question for this log is whether the real INGV-camera detector — the constant 19-class YOLO watcher we run, load-guarded, on INGV's own Etna garr.tv stream — can be put on that footing. Crucially, we do not carry any number over from the other project; we run this detector on real Etna frames and report what happens.
What we measured. Load-guarded on the mission host (PHOENIX health checked, busy-markers honored, yielding whenever the operational pipeline needed the machine), we grabbed 100 live frames off the Etna stream through the detector's own capture path and scored every frame at a deliberately low confidence floor (0.03) so the full tail of the score distribution would show. The result across all 100 frames: zero visible detections, zero firings of any of the nine volcanic-alert classes (lava incandescence, active flow, fountaining, strombolian, ash, pyroclastics, incandescent ejecta, volcanic lightning, new-vent), and zero thermal hotspots. The detector was completely, correctly silent.
Why the silence is genuine but the null is degenerate. Two things are true at once. Genuine: Etna is in a quiescent phase, so there are no positive events to detect — a silent detector is the right answer, and this is a real operational measurement that the model is not false-firing. Degenerate: the frames in this session were also dark/obscured (visible-panel mean brightness ~25/255 — a clouded or low-light view), so the detector saw neither volcanic activity nor the daylight confusers (sunset/twilight glow, illuminated steam, bright cloud edges) that would actually stress a threshold. A null distribution made only of near-black frames cannot calibrate a false-alarm rate, because it contains none of the false-alarm opportunities. So we have a real “detector behaves” snapshot, but not the multi-regime null that a conformal calibration needs.
The transferable design, grounded in this detector's real structure. The method is not speculative for this model, because the model already carries the regime handles it would use: a per-frame daylight flag and explicit regime classes (cloud_obscuration, night_noscene, sunset_twilight_glow). The calibration is: (1) accumulate the detector's per-class confidence scores over a long, quiet, multi-regime window (this is the null — every firing during quiescence is by definition a false alarm); (2) within each regime bin, set the alert threshold as a conformal quantile of that regime's null scores to hold a target false-alarm rate (e.g. 1%), rather than the single ad-hoc 0.45 the detector uses today; (3) keep the existing temporal-voting (X/3 frames) and the FIRMS on-/off-edifice geometric gate as independent confirmers layered on top. When Etna reactivates, the same accumulated null gives a distribution-free bound on how often the alarm fires when nothing is happening — the property that matters for a detector that must not cry wolf on a public volcano.
Claim status: DESIGN + partial measurement, NOT a validated calibration. Measured and standing: the operational detector produces a clean zero across 100 real frames in the current quiescent, obscured regime (no false alarms, no spurious thermal). Not yet earned: any per-regime conformal threshold, because the session's frames are a single degenerate (dark) regime with no positives and no daytime confusers.
What this does not claim: it does not import a detection or false-alarm number from the fusion work — recall against real eruptive activity is unmeasurable until Etna next erupts, and false-alarm calibration is unmeasurable until a diverse-regime null is collected. It does not claim the detector is validated; it claims the detector is currently well-behaved and structurally ready for regime-conditioned conformal calibration.
Method note. Frames captured through the detector's production path; scores read at a 0.03 floor to expose the full null tail; run entirely load-guarded so the analysis never contended with the operational mission system.
Next research test: stand up a rolling null-collector on the running detector — append every frame's per-class max score plus its regime bin (daylight/cloud/night) to a persistent log over days, not one session — then fit per-regime conformal thresholds and compare their held-out false-alarm rate against the current fixed 0.45. First deliverable is the collector; the calibration follows once the mountain, or at least the daylight, gives us a non-degenerate null.
Public data source:GARR TV INGV EtnaTVChn live stream (channel ingv_catania, CC BY 4.0). Statistical reporting: the reported null is a complete census of the 100 captured frames (not a sample), so it is quoted as exact counts; no proportions are inferred beyond them.
entry 0086
A re-ranker cannot improve the flank-camera veto — and an observation-neutral truth reveals why: the camera “confirmed” label is partly an observability artifact
Date: 2026-07-08 14:30 UTC Status: MEASURED NEGATIVE (small-n, with CIs) — a grouped 5-fold cross-validation over 203 camera crops / 159 frames against two truths, one observation-dependent and one observation-neutral. No model promoted. Extends the flank-camera veto [camera-veto] and the thermal-fusion work [thermal-fusion].
The analogy. A technique that fixed a fire-detection classifier elsewhere — retrain a “re-ranker” on confirmed events, then check the gain against an independent truth — was carried over to the Etna flank-camera veto to see if it helps here too. It doesn’t. But the test earned its keep in a different way: it exposed that our camera “confirmed” label is measuring, in part, whether the volcano was visible to the camera (night, clear sky) rather than whether it was active. A camera sees incandescent lava best at night; so “the camera confirmed it” and “it was observable as glow” are tangled together.
BLUF. On 203 crops (56 camera-confirmed volcanic, 147 not), the deployed veto is a healthy scorer against the camera truth (AUC 0.862, CI 0.806–0.913). A retrained re-ranker does not beat it (detection features 0.833; all features 0.877 — overlapping CIs). More important: switch to an observation-neutral truth (the INGV-OE bulletin lava flag, which does not depend on the camera seeing anything) and everything collapses — the deployed veto falls to 0.522 (chance), detection features fall below chance (0.391), and the best remaining predictor becomes the observation conditions themselves (0.619). Camera-confirmed positives are 53.6% night vs 32.0% night for negatives. So the strong camera-truth number is inflated by an observability confound baked into the label; there is nothing to promote, and the real obstacle is the truth, not the classifier.
Results — two truths, grouped 5-fold out-of-fold AUC
Observability share. Day-and-clear share: camera-positives 17.9%, bulletin-lava-positives 10.8% (gap 0.071). Night share: camera-positives 53.6% vs camera-negatives 32.0%; bulletin-lava-positives 49.0%. Incandescence is a night/clear-sky phenomenon for a visible camera, so the camera-confirmed class is night-enriched independent of activity.
The trap it caught
Read naively, the deployed veto’s 0.862 looks like strong volcanic-activity detection. The de-confounding shows three converging problems. (i) On the camera truth, observation-condition priors alone reach 0.743 — much of the “signal” is explained by when the scene was observable, before any volcanic content. (ii) On the observation-neutral truth the deployed score is at chance (0.522, 0.5 inside its CI) and the detection features are below chance (0.391, CI entirely < 0.5) — mildly anti-correlated, because bulletin lava is often reported in night/obscured windows where visible-incandescence keying behaves differently. (iii) On that neutral truth, observation conditions are the best predictor (0.619). Conclusion: the camera-truth performance is not a clean measure of activity; it is inflated by observability, and the activity-detection lift does not survive an observation-independent check.
Reproducibility detail
Corpus. A curated set of ~470 Wayback-archived INGV-OE webcam stills (Etna-dominant, plus Stromboli / Vulcano), each carrying a bulletin-oracle truth (state / lava / ash, matched to INGV-OE & GVP weekly bulletins), observation conditions (day/night, visibility), and detection-time image statistics (scene mean/std, thermal-hotspot fraction and count). Crops (596; volcanic 449 / neither 147) carry 1792-d SigLIP-large + DINOv2-base embeddings. The grade ran on the 203 crops / 159 frames whose frame-ids joined the label file (a 34% join; 393 crops did not join — largely non-Etna / different keyspace); the bulletin-lava truth was balanced on that subset (102/101).
Two truths. Camera-confirmed = crop label volcanic vs neither (observation-dependent). Observation-neutral = bulletin lava flag, true vs not (independent of what the camera could see; the closest available analog to a satellite-thermal / MIROVA truth, which does not yet exist for this summit on our side).
Features (non-leaky). Detection = deployed-veto out-of-fold score + thermal-hotspot fraction + thermal-hotspot count (excludes the confirmation label/caption). Priors = day/night, visibility, scene mean/std, hour, camera panel. Deployed scorer = the production veto classifier (RBF support-vector on the crop embeddings; deployed report accuracy 0.918 / macro-F1 0.887).
Protocol. Stratified group 5-fold cross-validation grouped by frame (no frame appears in both train and test), out-of-fold AUC with 95% bootstrap CIs; observability shares computed per class. Run read-only on the corpus; output written only to a hidden diagnostic record (no surfacing path, reversible). No change was made to the deployed veto.
Claim status. Measured negative on a small corpus (n=203, wide CIs ±0.05–0.08). Two truths, one observation-neutral; no model deployed or promoted.
Literature alignment: CONSISTENT. Observability/selection bias in visual volcano monitoring — incandescence favouring night, plumes favouring daylight/clear sky — is well documented; that a visible-camera “confirmed” label encodes viewing conditions is expected, and is exactly why satellite-thermal (MIROVA-style) and multiparametric monitoring exist.
Where we are stricter. We refuse to accept the 0.862 camera-truth AUC at face value and test it against an observation-independent truth; we hold the deployed veto unchanged rather than layering a re-ranker that adds no defensible lift.
What this does NOT claim. It does not claim the deployed veto is bad at its actual job (crop wildfire-vs-volcanic as the camera sees it — it is good at that, 0.862). It does not claim volcanic activity is unpredictable — only that this camera truth is observability-confounded and this corpus (203) is too small for strong claims. The bulletin-lava truth is coarse (weekly windows) and a lava-within-eruptions channel, not a true active/background thermal truth.
Next test. Stand up a genuine observation-neutral thermal truth over the summit (MIROVA, Sentinel-3 SLSTR / SEVIRI FRP, or an own-thermal-camera FRP) and re-grade; fix the 393-crop join gap to use the full corpus; then re-examine whether any detection signal survives. The higher-leverage detection upgrades are multi-modal fusion (camera + satellite thermal + seismic tremor + SO₂) and temporal detection, not a single-frame re-ranker.
The observation-neutral thermal truth is now real (FIRMS) — and it confirms the previous entry: once provenance is controlled, the flank-camera veto is at chance against thermal activity
Date: 2026-07-08 18:10 UTC Status: MEASURED NEGATIVE (confirmatory) — the follow-up promised in entry 0087: we built the genuine observation-neutral thermal truth, fixed the join gap, and caught a provenance confound that would otherwise have overturned the finding. No model promoted.
What entry 0087 asked for. Entry 0087 concluded that the camera “confirmed” label is observability-confounded, and that the honest next test was to stand up a genuine observation-neutral thermal truth (a MIROVA-style satellite-thermal channel) and re-grade, and to fix the 34% join gap. We did both. The result is a textbook case of why a de-confounding channel must itself be de-confounded.
BLUF. We built a real observation-neutral truth from NASA FIRMS (VIIRS/MODIS) active-fire detections over the summit — a year-round polar-overpass thermal signal that does not depend on the flank camera seeing anything. Graded naively across the full corpus, the deployed veto scored 0.928 against this thermal truth — an apparent reversal of entry 0087. It is not real. The full corpus mixes two provenances (203 archival stills vs 393 later-harvested eruption frames), and the harvested frames are 100% FIRMS-positive while the veto separates harvested-from-archival at AUC 0.967 — so the 0.928 is the veto telling curated eruption frames apart from archival stills, not detecting thermal activity. Restrict to archival Etna crops only (provenance held constant, both thermal classes present, n=127): the deployed veto falls to 0.573, CI 0.469–0.676 — chance, with 0.5 inside the interval. Entry 0087 holds and is strengthened: even against a proper satellite-thermal truth, the single-frame veto does not discriminate real thermal activity once the confound is removed.
Results — the naive number, and what survives provenance control
Grade
n (pos/neg)
Deployed veto AUC (95% CI)
Reading
FIRMS thermal truth, full corpus (naive)
520 (443/77)
0.928 (0.899–0.952)
Apparent reversal — but see confound
— detection features alone
520
0.927
Tracks the veto (same confound)
— day/night prior alone
520
0.697
Not the driver this time
Veto separates provenance (harvest vs archival)
—
0.967
The veto’s real axis on this corpus
FIRMS-positive rate by provenance
—
archival 0.394 / harvest 1.000
Harvest is all-positive → leakage
FIRMS thermal truth, archival Etna only (controlled)
127 (50/77)
0.573 (0.469–0.676)
Chance — confirms entry 0087
The join gap, resolved
Entry 0087 graded on 203 of 596 crops (34%) because 393 crops did not join the label file. The gap is now explained: those 393 are later-harvested eruption frames — all volcanic positives, with zero negatives. Adding them does not extend coverage of the decision boundary; it injects a one-sided, single-provenance mass. That is why the full-corpus camera-truth AUC leaps to 0.963 (n=596, 449 positive) while the honest archival-only camera-truth grade stays at 0.84 (n=203) — the jump is distribution shift, not detection skill. The honest camera-truth number remains the archival one, consistent with entry 0087’s 0.862 (fold-seed / balance differences account for the small gap).
The trap it caught (again, one level deeper)
Entry 0087 caught an observability confound in the label. This entry caught a provenance confound in the newly built neutral truth itself. Both would have produced a falsely optimistic headline (0.862 there, 0.928 here); both dissolve under a controlled comparison. The lesson is that a de-confounding channel earns trust only after its own nuisance structure is held constant — here, that the thermal-positive rate is not itself a proxy for which batch a crop came from. With provenance fixed and both thermal classes present, the deployed veto is at chance (0.573, CI spans 0.5). There is nothing to promote.
Reproducibility detail
Neutral thermal truth. NASA FIRMS VIIRS/MODIS active-fire detections queried for the summit AOI over the 54 capture dates (all 54 reachable), each crop labelled thermal-positive if a FIRMS detection fell within the summit window; this is the observation-neutral (MIROVA-analog) channel entry 0087 called for. Provenance control. Crops carry a provenance tag (archival = the original ~470-still Wayback set; harvest = a later curated eruption-frame batch). The controlled grade restricts to provenance=archival & volcano=etna & thermal-label present (n=127, 50 thermal-positive / 77 negative) so both provenance and volcano are constant and both thermal classes are present. Provenance-separation probe. The same deployed out-of-fold veto score, graded with provenance (harvest=1/archival=0) as the target over all Etna crops, AUC 0.967. Protocol. Grouped 5-fold out-of-fold veto scores, AUC with 3000-sample bootstrap CIs; read-only on the corpus; output written only to a hidden diagnostic record (.ingv_rerank_full_shadow.json), no surfacing path, deployed veto unchanged.
Claim status. Measured negative, confirmatory. The controlled archival grade is small (n=127, CI ±0.10) but decisive in direction: 0.5 sits inside the interval. Two independent neutral truths now agree — the coarse bulletin-lava channel (entry 0087, 0.522) and the FIRMS thermal channel provenance-controlled (this entry, 0.573).
Literature alignment: CONSISTENT. Batch/provenance leakage inflating a held-out metric is a well-known failure mode; the fix — hold the nuisance variable constant rather than trusting a raw cross-batch AUC — is standard. That a visible-camera veto does not, by itself, track satellite-thermal activity is expected and is the standing rationale for multiparametric (thermal + seismic + gas) volcano monitoring.
Where we are stricter. We refused the 0.928 at face value, probed its provenance structure, and re-graded with provenance held constant — reporting the confound openly rather than banking the headline. A model that had been promoted on the 0.928 would have been promoted on a batch artifact.
What this does NOT claim. It does not claim FIRMS is a bad neutral truth — it is the right channel; the limitation is that our archival corpus offers only 127 crops with both thermal classes, too few for a strong positive claim in either direction. It does not claim the veto is bad at its deployed job (crop volcanic-vs-wildfire as the camera sees it). It claims only that single-frame veto signal does not survive an observation-independent thermal check once provenance is controlled.
Next test. Grow a balanced archival neutral-thermal corpus (archival crops carrying FIRMS negatives as well as positives — the binding constraint is only 127 today), then test multi-modal fusion (camera + satellite thermal + seismic tremor + SO₂ TROPOMI) rather than any single-frame re-ranker. The detection ceiling here is the truth and the modality, not the classifier.
References. NASA FIRMS VIIRS/MODIS active fire; INGV-OE & GVP weekly bulletins; prior entry [0087]; deployed flank-camera veto [camera-veto]; thermal-fusion [thermal-fusion].
entry 0088
References
Primary sources and Consensus links used in the literature-alignment blocks above. Full annotated mapping in the repository (references/LITERATURE_ADDENDUM_v1.md).
Ghali & Akhloufi, 2023, Fire — Deep Learning Approaches for Wildland Fires Using Satellite Remote Sensing Data: Detection, Mapping, and Prediction. link
Zhang et al., 2024, Neurocomputing — 10-minute forest early wildfire detection: fusing multi-type and multi-source information via recursive transformer. link
Wang et al., 2024, Geo-spatial Information Science — FASDD: an open flame and smoke detection dataset for deep learning. link
Dong & Wang, 2025, Remote Sensing — HybriDet: a hybrid CNN+Transformer for wildfire detection. link
Xu et al., 2026, Science of Remote Sensing — Major Improvements in Spaceborne Early Fire Detection and Small-Fire FRP Retrieval with MTG-FCI. link
Paugam et al., 2025 — Fire behaviour monitoring using Meteosat Third Generation (FCI-FireDyn algorithm). link
Paugam et al., 2026 — Leveraging MTG-FCI fire observations for event-based fire behaviour monitoring. link
EUMETSAT — Meteosat Third Generation (FCI + Lightning Imager). link
NASA Earthdata — VIIRS I-Band 375 m Active Fire Data (confidence field definition). link
NASA FIRMS — Fire Information for Resource Management System. link
Dhage, 2025 — Systematic Absence of Low-Confidence Nighttime Fire Detections in the VIIRS Active Fire Product. link
Ouazri et al., 2026 — Machine-learning wildfire occurrence prediction (ERA5/FWI/FIRMS, northern Morocco). link
Han et al., 2026, Forests — A Comparative Review of Wildfire Danger Rating Systems: fuel-moisture modeling frameworks. link
McNorton & Di Giuseppe, 2024, Biogeosciences — A global fuel characteristic model and dataset for wildfire prediction. link
Jakubik et al., 2023 — Prithvi: foundation models for generalist geospatial AI (HLS; wildfire-scar fine-tune). link
Szwarcman et al., 2024, IEEE TGRS — Prithvi-EO-2.0: a versatile multitemporal EO foundation model. link
Shibli, Nascetti & Ban, 2026 — Low-Rank Adaptation of Geospatial Foundation Models for Wildfire Mapping using Sentinel-2. link
Hong et al., 2023, IEEE TPAMI — SpectralGPT: spectral remote-sensing foundation model. link
Liu et al., 2023, IEEE TGRS — RemoteCLIP: a vision-language foundation model for remote sensing. link
Li et al., 2025, IEEE TGRS — FlexiMo: a flexible remote-sensing foundation model (sensor/resolution heterogeneity). link
Torrisi, 2025, Annals of Geophysics — Integrated ML for volcanic cloud tracking: Etna lava fountains 2020-2022. link
Torrisi et al., 2024 — Deep learning + geostationary remote sensing for volcanic-cloud monitoring (ABI/SEVIRI Ash RGB). link
Corradino et al., 2023, IEEE TGRS — Detection of subtle thermal anomalies: deep learning on the ASTER global volcano dataset. link
Copernicus Data Space — Sentinel-5P / TROPOMI documentation (SO2, aerosol index). link
Misra, Moorthi & Dhar, 2026 — Quantum annealing for remote-sensing data processing: a review of optimization applications. link
Dent et al., 2026, Communications Engineering — Network separation modeling and quantum computing for wildfire fuelbreak strategy. link
Rainjonneau et al., 2023, IEEE JSTARS — Quantum algorithms applied to satellite mission planning for Earth observation. link
Google OR-Tools — CP-SAT solver documentation (mandatory classical baseline). link
Purnama et al., 2024 — Mediterranean forest-fire vulnerability ML in Turkiye (land cover, roads, population, weather, terrain). link
Zhang, Gao & Shi, 2025 — Lightning-ignited wildfire prediction in Texas (contrast region). link
Bountzouklis et al., 2023 — Explainable AI for wildfire ignition causes in Southern France. link
Kurchaba et al., 2022 — TROPOMI ship-plume NO2 segmentation (satellite plume ML is feasible but low-SNR). link
NIST, 2024 — FIPS 204: Module-Lattice-Based Digital Signature Standard (ML-DSA / Dilithium). link
NIST, 2024 — FIPS 203: Module-Lattice-Based Key-Encapsulation Mechanism Standard (ML-KEM / Kyber). link
Emergency management — multi-hazard situational awareness for INGV
In plain terms. INGV does not only watch for fire — it is Italy's multi-hazard
watch floor: earthquakes, eruptions, ash, ground swelling and tsunamis, feeding Civil
Protection around the clock. ADRIZ is not a replacement for that authoritative network.
It is a fusion + independent-corroboration layer on top of it: it pulls third-party
satellites, cameras and (optionally) hyperlocal ground nodes into one auditable picture,
faster, and cross-checks each hazard signal against independent evidence. Where INGV's
instruments are the truth, ADRIZ adds speed, a second witness, cross-modal correlation, and
coverage in the gaps — with the same honesty as the rest of this site: proven,
scoped, and roadmap items are labelled, and every number carries its source and confidence.
Scope. ADRIZ's contribution is situational awareness / decision support, independent
corroboration, and hyperlocal ground sensing. It deliberately does not duplicate INGV's
authoritative seismic, volcanic-surveillance or tsunami-warning networks; it consumes their
public products and adds value around them. Tsunami warning is explicitly out of scope.
Multi-hazard capability map — what ADRIZ adds, and how honestly
Hazard lane
What ADRIZ adds
Status
Public source
Honest limit
Volcanic — lava effusion extent
20 m quantitative active-lava footprint from Sentinel-2 SWIR (NHI), e.g. 18.5 ha on 2025-08-21 — a number the weekly bulletin narrative does not carry.
PROVEN
Copernicus / Element84 Sentinel-2 L2A
5-day optical revisit; a short paroxysm seen >2–3 days late is missed (the Jun-2025 +3d miss).
Wildfire-vs-volcanic on INGV's own camera frames: 9.7% volcanic false-alarm [4.5%, 19.5%], n=62; 4.8–6.5% at operating confidence; wildfire recall 96.8%.
PROVEN
INGV-OE EtnaTVChn (CC BY 4.0)
Flame-vs-lava needs an orthogonal cue (geometry + off-vent corroboration); real on-camera wildfire positives are rare (synthetic-augmented).
Ground deformation (InSAR)
Sentinel-1 line-of-sight deformation (HyP3/GAMMA) as an independent inflation/deflation + coseismic signal.
PRODUCT
Copernicus Sentinel-1 · ASF HyP3
Atmospheric noise + revisit; automated alerting and time-series inversion are roadmap, not yet claimed.
Seismic & cascading impacts
Hyperlocal ground seismic node (P-wave puck) + post-earthquake fire-ignition awareness (broken gas/power). INGV's seismic network is authoritative; ADRIZ adds a hyperlocal node and the cross-hazard fire-after-quake link.
SCOPED
ground node (build not authorized) · NASA FIRMS
Does not replace INGV seismology; node is scoped only. We MEASURED the quake→wildfire correlation for Sicily (INGV catalogue × FIRMS, case-crossover) and it is NULL — no cascade (research entry 0089). So this lane is hyperlocal shaking detection + the urban/structural post-quake fire link from the literature, NOT a vegetation-fire correlation.
Multi-hazard situational awareness
One auditable, fused picture (the “wildfire state” engine generalized) merging satellite + camera + ground + bulletin evidence for the surveillance room, with provenance and confidence on every layer.
ROADMAP
fusion of the above public sources
Conceptual / design stage; value is decision-support and speed, not new authoritative measurement.
Tsunami
—
OUT OF SCOPE
—
No sea-level sensing; this is CAT-INGV's authoritative remit and ADRIZ makes no claim here.
Claim status: EXPLORATORY/positioning — the volcanic and camera lanes are
PROVEN with the numbers shown elsewhere on this site; InSAR is a built PRODUCT; the seismic
node and multi-hazard fusion are SCOPED/ROADMAP and make no measured claim yet.
Current literature & alignment. The volcanic lanes agree with the volcano-remote-
sensing literature (Torrisi 2025/2024; Corradino 2023) and the Sentinel-5P documentation
already cited on the Proof-of-value tab. The deformation and multi-hazard lanes rest on
operational European services — Copernicus Sentinel-1 InSAR and the Copernicus Emergency
Management Service — rather than on ADRIZ measurements; peer-reviewed InSAR-deformation
and multi-hazard-EO references are queued to be added (citation source temporarily rate-limited).
Statistical reporting: every proven rate on this page carries a sample size and a
Wilson 95% confidence interval; read the interval, not the point estimate.
What hazard or lane are we missing? This emergency-management map is a draft for INGV review — tell us which hazards, data sources, or cascading risks to add or drop.
Live data feeds— every public source we pull for Etna fire + volcano tasks
Public Etna cameras (verified)
Camera wall — live flame / smoke watch
Loading…
Every public Etna viewpoint runs the same YOLO
detector + crop-level Qwen3-VL veto, refreshed about every 75 s. The big badge is
the verdict an operator needs at a glance:
🔥 FLAME = a hot/bright crop the
veto confirmed as wildfire (not lava/volcanic);
💨 SMOKE = pass-through
early-warning smoke (never second-guessed);
✓ CLEAR = no wildfire-class hit.
Any FLAME/SMOKE tile floats to the top. Windy cams are low-res coarse corroboration. Offline
sources are shown honestly — never faked.
Loading cameras…
Layers
Volcanic (SO2)
Wildfire active
Quiet AOI
FIRMS fire (size = FRP)
Live camera (day RGB / night thermal)
Aircraft — fixed-wing (live ADS-B)
Helicopter (live ADS-B)
AIS vessel (live)
Maritime rescue / incident vessel
Emergency / rescue aircraft (air or ground)
What you are seeing (for the INGV reader)
This is the system running live on real data over Etna. The orange dots on
the map are NASA FIRMS NRT active-fire detections (VIIRS/MODIS, ~3–6 h latency),
refreshed every 30 min by a serverless worker — not a static snapshot. The coloured AOI
markers are our per-area verdict (volcanic / wildfire / quiet) with our score, confidence and
source timestamp. Below, the system auto-grades itself against your own weekly bulletin
(via GVP 211060). For the curated, verifiable head-to-head — our detections next to your own
reports, with links and honest misses — open the “Proof of value” tab above.
Per-AOI status — OUR assessment
Loading…
Live camera — INGV's own feed (EtnaTVChn)
Loading camera…
Live wildfire alerts — crop-level Qwen3-VL veto
Hot/bright crops (flame, lava) and large/diffuse smoke are routed to a
vision-language verifier per-crop to disambiguate wildfire from volcanic
incandescence/degassing; small distant smoke is never second-guessed (early-warning). Each
alert carries the veto verdict + reasoning and full provenance.
Loading alerts…
ADRIZ vs INGV — auto self-grading
Live agreement against the INGV-OE bulletin
We ingest INGV-OE's public weekly reporting on Etna (via Smithsonian GVP,
volcano 211060) into a machine-readable ground-truth feed and AUTO-COMPARE it against our own
satellite-derived calls. Each rate carries a sample size n and a Wilson 95% CI.
Read the CI, not the point estimate — the overlap is thin and historical.
Loading comparison…
Dimension
Agreement
95% CI
n
per-date detail (our call vs the INGV weekly window)
Obs date
INGV week / state
Our SO2 / fire
Match
What we ingest from INGV-OE
Loading INGV feed…
SO2 here is a plume-presence cue, not an eruptive-state
classifier. Active fire is FIRMS NRT (~3–6 h). INGV bulletins are weekly;
our signals are per-overpass, so per-day calls and the weekly window legitimately differ at
episode boundaries.
Capability slots
Data latency / freshness
Layer
Observed
Age
Typical
Operating model
Real-time (auto-refreshed):
Active fire (FIRMS NRT) — pulled by a serverless Worker on a 30-min cron and
served from edge storage; the page re-checks it every 5 min. Source latency ~3–6 h.
SO2 plume status — refreshed each Sentinel-5P overpass (~daily) by the feed
processor (this preview reads an archived per-scene series).
File-fed (update when their result file is published):detector alerts, multi-source thermal/FRP, escalation flag, burn-scar, fuel-danger.
These are the heavy model layers — they show pending until their result file lands,
then light up. They are not live-polled.